· 6 min read
Introducing Clustering III: Challenges and Pitfalls

[This post was written in collaboration with Christian Bauckhage and Rafet Sifa.]
In the previous post of this series we introduced the theoretical foundations of cluster analysis and the various categories of algorithms. In this post we take a specific look at the challenges associated with running a cluster analysis on behavioral telemetry from games.
Clustering behavioral data from games does not involve any unique challenges: the challenges associated with high dimensionality, large scale and validation are also present in other fields, e.g. telecommunications, medicine and astronomy.
Similarly, the challenges that are associated with the inception of cluster analysis, notably feature selection and communication of results, are known from other domains. And yet, games are different beasts.
While individually the challenges of cluster analysis are known from other application areas, in games there is a specific mixture of these, with an emphasis on dimensionality, scale, communication of results – and notably an over-arching goal of optimizing user experience and user engagement in what is fundamentally a creative industry.
Some of the key concerns encountered when using cluster analysis to evaluate player behavior include:
Cluster validation
Cluster validation was outlined in the previous post of this series. Though running cluster algorithms has been made easy thanks to strong analytical software, validation is a common problem in analytics, as it requires expertise.
Interpretability and visualization
Validated cluster models should be interpreted in light of the included behaviors’ context. For example, a model can have a very good fit with the data, but the result can be uninformative. Feature selection is one of the key ways to avoid models with no practical application value.
Communicating results
In order to implement the results of a behavioral cluster analysis, the outcome must be presented in a language that is understandable to the stakeholder in question. Professionals in marketing, design, management and engineering may use different professional jargons, which must be taken into consideration when describing results. The use of visualization techniques suited for the target stakeholder group is critical to ensure acceptance of the results and thus, implementation of design changes.
From model to action
A cluster analysis in and of itself will provide insights into the patterns of players’ behavior; however, it will not necessarily show how to change a game’s design or its business strategy towards modifying those behaviors. Just like in game user research/user testing analytics results need to be communicated to and interpreted by the relevant stakeholders.
Time-dependency
Players can change their behavior, game communities may evolve, and games themselves can change throughout their lifecycle. Therefore, it is also possible for clusters to change. A traditional cluster analysis provides a static snapshot of behavior, which has a limited shelf life. This means that cluster analyses should be re-run in response to e.g. patch releases, as well as following a regular schedule for persistent games.
It is also possible to use time in a more dynamic fashion, by including temporal behavioral patterns in clustering, e.g. for finding temporal patterns leading to player churn, or conversions from non-paying to paying users. Implementing temporal information in a cluster analysis can be done, for example, via time-series analysis (such as graph-based clustering).
High dimensionality and big data
While the definition of when a dataset has a “high” dimensionality is somewhat nebulous, for cluster analysis in games anything from a dozen to hundreds and even thousands of dimensions can occur (e.g. player forum mining). High dimensionality in data allows for finding behavioral features that determine the grouping of players, but makes the analysis process itself more cumbersome. Notably, many of the common clustering algorithms do not scale well to large datasets, or distance functions encounter problems in high-dimensional space – the aptly named “curse of dimensionality” – because the number of grid points increase exponentially with dimensionality. Generally, problems with dimensionality occur because a fixed number of data points become increasingly sparse as the number of dimensions goes up. This increases distance/similarity between points. Beyer et al. noted that for certain data distributions, the relative difference of the distance of the closest and farthest data points of an independently selected point goes to zero with increasing dimensionality, as follows:
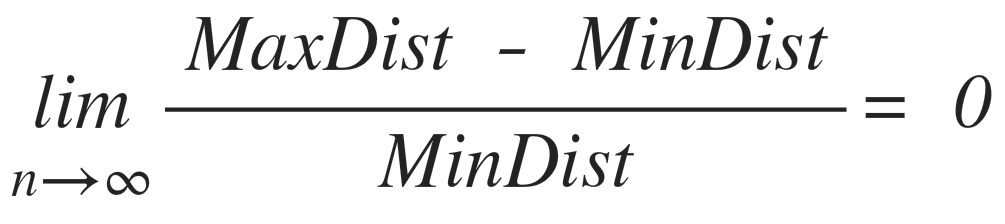
This means that in high dimensionality space, distances between points become relatively uniform, which invalidates the notion of nearest neighbor. In recent years there have been several developments towards improving the performance of algorithms for clustering high-dimensional data, or the development of new approaches. For example, pre-clustering methods such as canopy clustering which pre-partitions data and then clusters each partition individually. Canopy clustering is often used as a pre-processing step for k-means or hierarchical clustering. Other examples of algorithms for high-dimensionality datasets include subspace clustering and correlation clustering.
Finding the right features
Feature selection is a topic that is increasingly relevant in the game industry due to the potential range of behavioral features in some games. While many monetization metrics, such as DAU, MAU and ARPU, are based on features that extend across games, they can be defined in different ways. For example, DAU (Daily Active Users) provide a concrete temporal frame, but what constitutes an “active” player is more vague. The problems with feature selection usually occur when trying to evaluate player behavior in relation to the actual game mechanics/design. Finding out that players e.g. have a tendency to churn at level 8 is in and of itself not valuable – drilling down and discovering the underlying causes for churn is. Identifying the features to investigate in these situations can be difficult. Furthermore, due to the often-changeable nature of notably persistent games, predicting which behaviors are valuable to track can be challenging as well. Cluster analysis can be used to assist with identifying important features, but this requires that the behavioral features are present in the dataset in the first instance.
Data type mixing
A typical problem of behavior analysis in games is the mixing of data types as behavioral features are often measured in different ways. For example, ratios (e.g. kill/death ratio or hit/miss ratio) may be mixed with categorical data (e.g. character type). Such data require a careful consideration of data normalization strategies.
This was the third post on clustering. In the fourth and final post of the series, we go into detail with a couple of practical examples of cluster analysis on behavioral telemetry from different games.
Acknowledgements
We are indebted to several colleagues for sharing their insights and feedback on this post, including but not limited to Christian Thurau, Fabian Hadiji and Shawn Connor.