A Claude Code skill that pulls product analytics from GameAnalytics, Adjust, and server data into a single dashboard. Built once by one developer, now run on demand by the whole team through Claude Cowork.
Challenge
Every studio tracks tons of KPIs. For the team, generating their weekly report took a full day: navigating dashboards, exporting each metric individually, and manually verifying the data. Time-consuming, repetitive, and error-prone. The bigger issue beneath the manual work: reporting was a one-person job. Anyone else on the team who wanted the numbers had to ask.
Solution
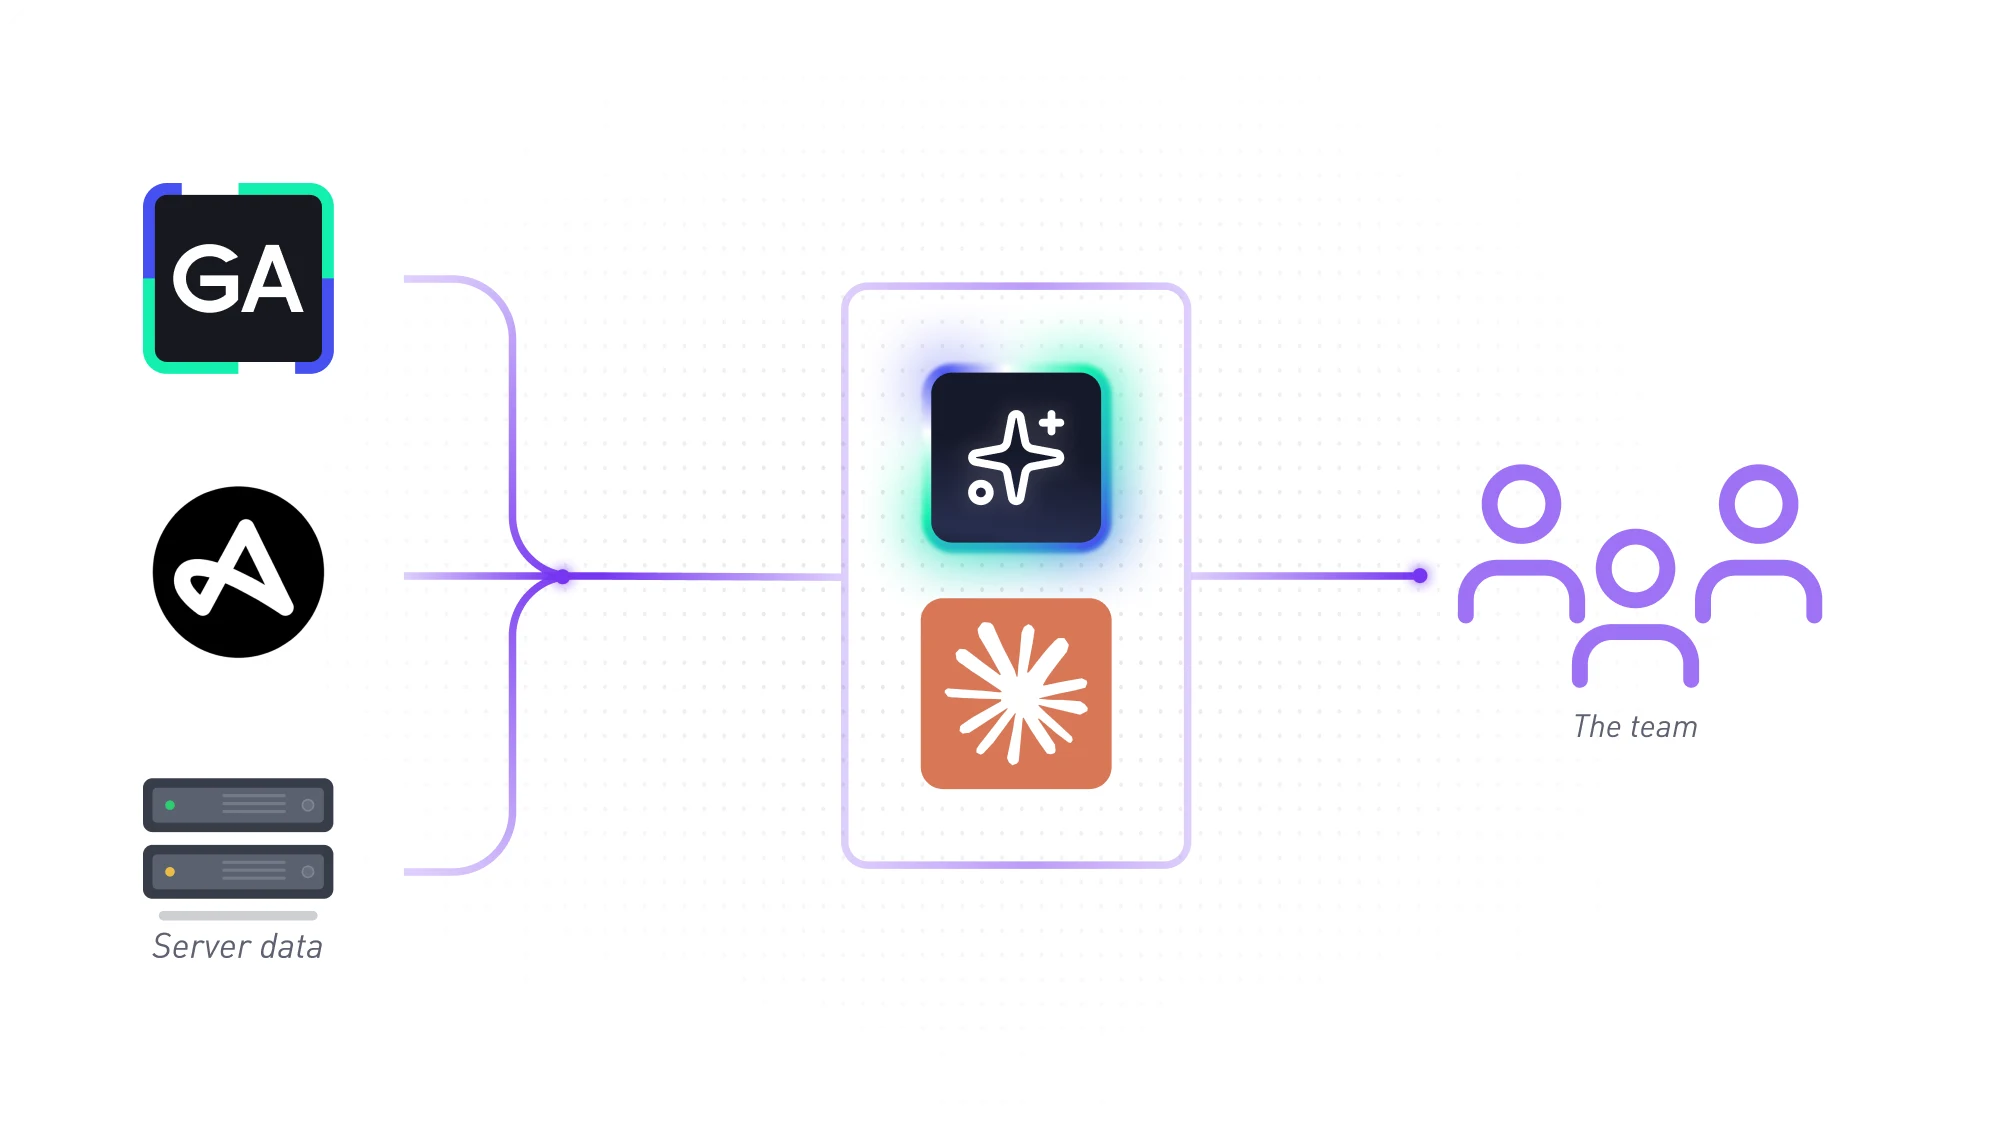
Within 10 minutes, the team built a GameAnalytics MCP-based Claude Code skill to automate the entire process. The skill pulls data, such as DAU, average revenue per paying user and daily active user (ARPPU & ARPDAU), Retention, first-time user experience (FTUE), and Revenue, from GameAnalytics via the MCP Server, alongside their server data and Adjust, into a single dashboard. The output is already analyzed, highlighting the metrics that need attention and celebrating those that are performing well. The developer built the skill in Claude Code. The rest of the team runs it in Claude Cowork, without ever opening a terminal.
About Blitz of Battle
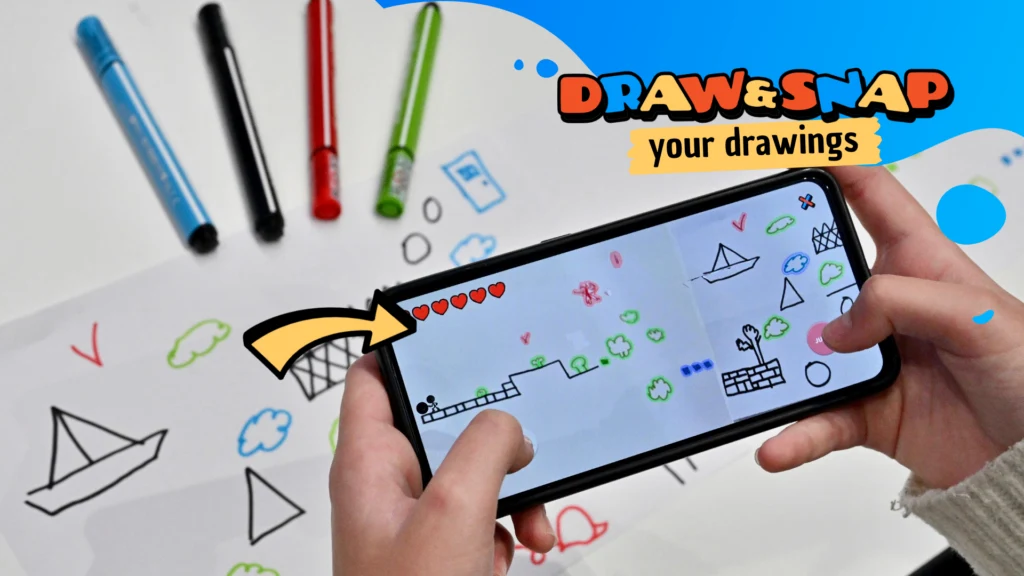
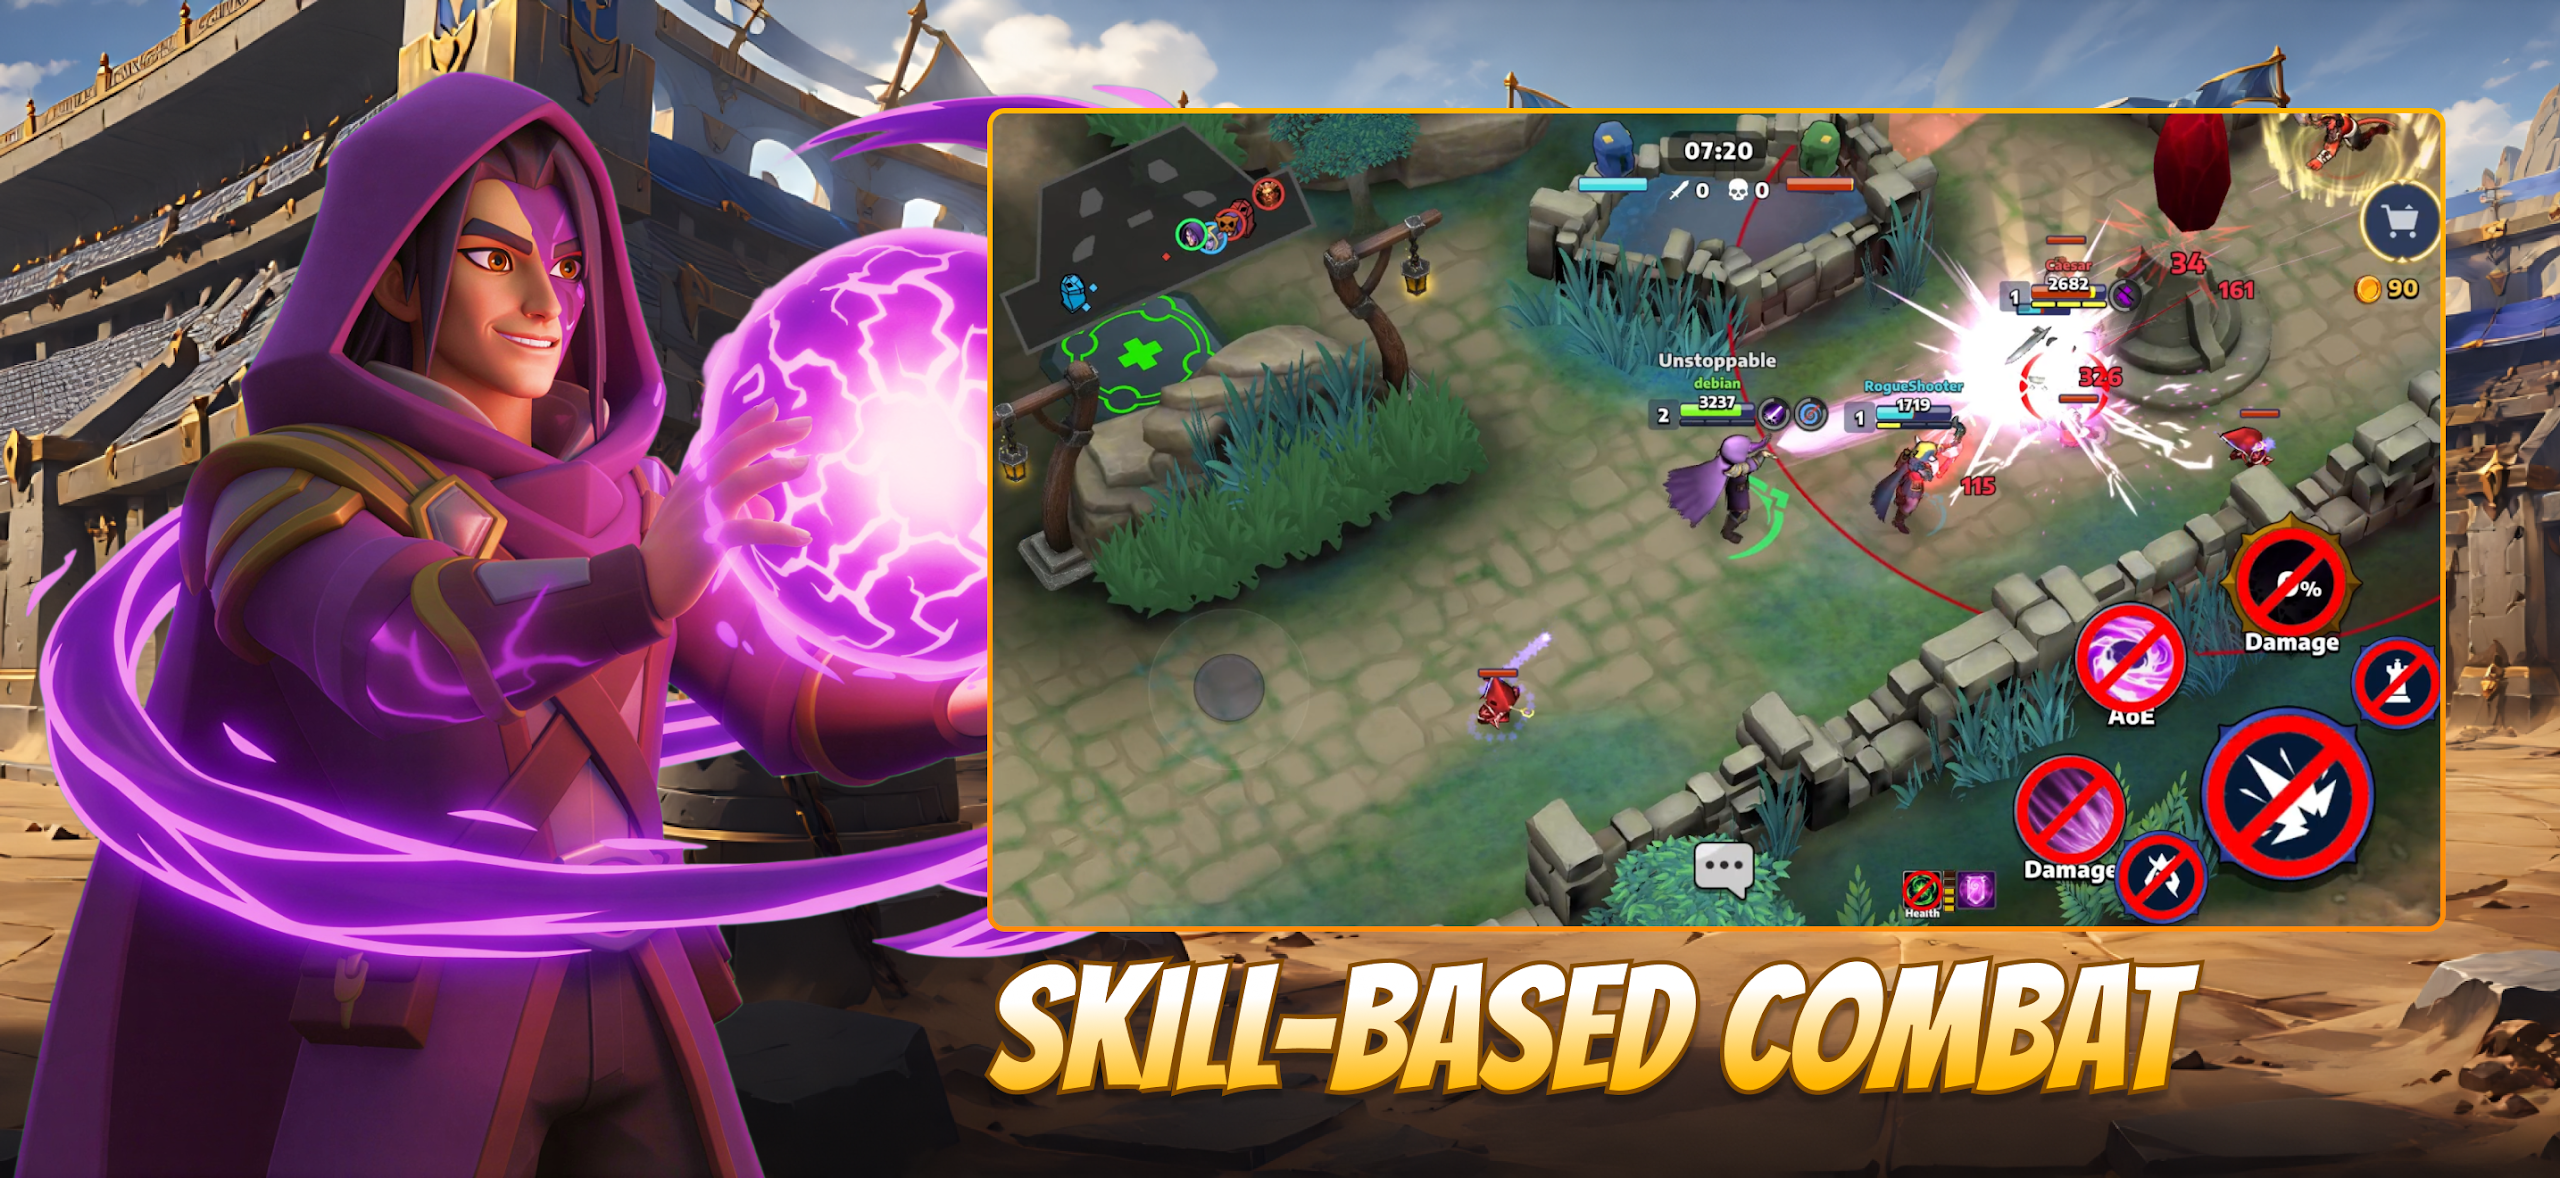
Blitz of Battle (BoB) is a real-time 2v2 blitz Multiplayer Online Battle Arena (MOBA). Three-minute matches, a ranked competitive climb, fast-paced mobile multiplayer at the core. The game relies heavily on teamwork, individual hero mechanics, and securing objectives to outsmart opponents on a compact map. With a revamped ranked system that pits you against real players and rewards instant promotions upon reaching point thresholds, it serves as a highly accessible alternative to traditional, longer-form strategy games.
Why the MCP Server matters here
The MCP Server did two things for BoB. It automated the reports, and it opened them up to the entire team, which was the major win.
Before the skill existed, generating the weekly report was a role. With the skill in Claude Cowork, it's a resource. The whole team can trigger it themselves, in the AI tool they already use for other work. Reporting stopped being something someone had to do, and started being something anyone can ask for.
"Before, we had to go into dashboards, export each KPI on its own, and check if the data was correct. Now, all anyone on the team has to do is say, 'Build the weekly report'. All data will be exported and arranged in a dashboard that is already analyzed, highlighting any issues and celebrating good metrics." - Publishing Director of Blitz of Battle
There's a second-order effect worth naming. When analysis becomes something the AI does, humans stop being the bottleneck between the data and the interpretation. The Publishing Director of BoB found the AI was surfacing correlations he wouldn't have thought to look at himself.
"It worked better than expected. I was able to get further analyses done by looking at correlations of metrics that I wouldn't normally be looking at." - Publishing Director of Blitz of Battle
Not every change is a product change
One example of what those correlations unlocked: attribution.
“Not every number change was due to product; sometimes it was due to different marketing campaigns we were experimenting with, and with the report, those changes were highlighted clearly.” - Publishing Director of Blitz of Battle
Before, retention numbers moving usually meant one thing. Something in the game had changed. That's the default assumption when you're only looking at product analytics. The team calls it a "game mindset."
With the report combining both GameAnalytics and Adjust sources, that assumption stopped being automatic. Not every retention shift was down to product. Sometimes it was down to a marketing campaign the team was running, bringing in a different cohort of players who behaved differently from the baseline. Without the marketing context alongside the game data, that would have looked like a product problem.
The report surfaces the actual cause. When numbers move, the team can see whether it's a product change, a campaign change, or both, without having to check multiple dashboards.
What's next
Blitz of Battle plans to build alerting into the reporting workflow. Instead of catching issues at the end of the week, the goal is to catch them as soon as they happen. A sudden surplus of soft currency, an unexpected drop in a core KPI, or anything else worth an urgent look would fire an alert automatically. Reporting is the foundation. Monitoring is the next step.
How the GameAnalytics MCP Server fits into modern AI workflows
The BoB’s team setup shows what changes when the MCP Server plugs into an AI tool the whole team uses. It stops being a data access layer for one person, and becomes an on-demand analytics service for everyone. Studios can move from data that lives in dashboards to data that responds to whoever asks for it, in whatever format they need.
That's what we're building for. Studios don't need every team member to become a data analyst. They need their AI tools to become one, and to be reachable to everyone.
How it works
The GameAnalytics MCP Server, available with PipelineIQ Pro, is a bridge that connects your game data to AI assistants like Claude, ChatGPT, Codex, Gemini, and Cursor. Instead of writing custom scripts or automating browser access, you let your agent query your data directly and get the analysis back, structured and ready to act on.
For Blitz of Battle, that meant one skill built in Claude Code that the whole team can trigger from inside Claude Cowork, without ever opening a terminal.