
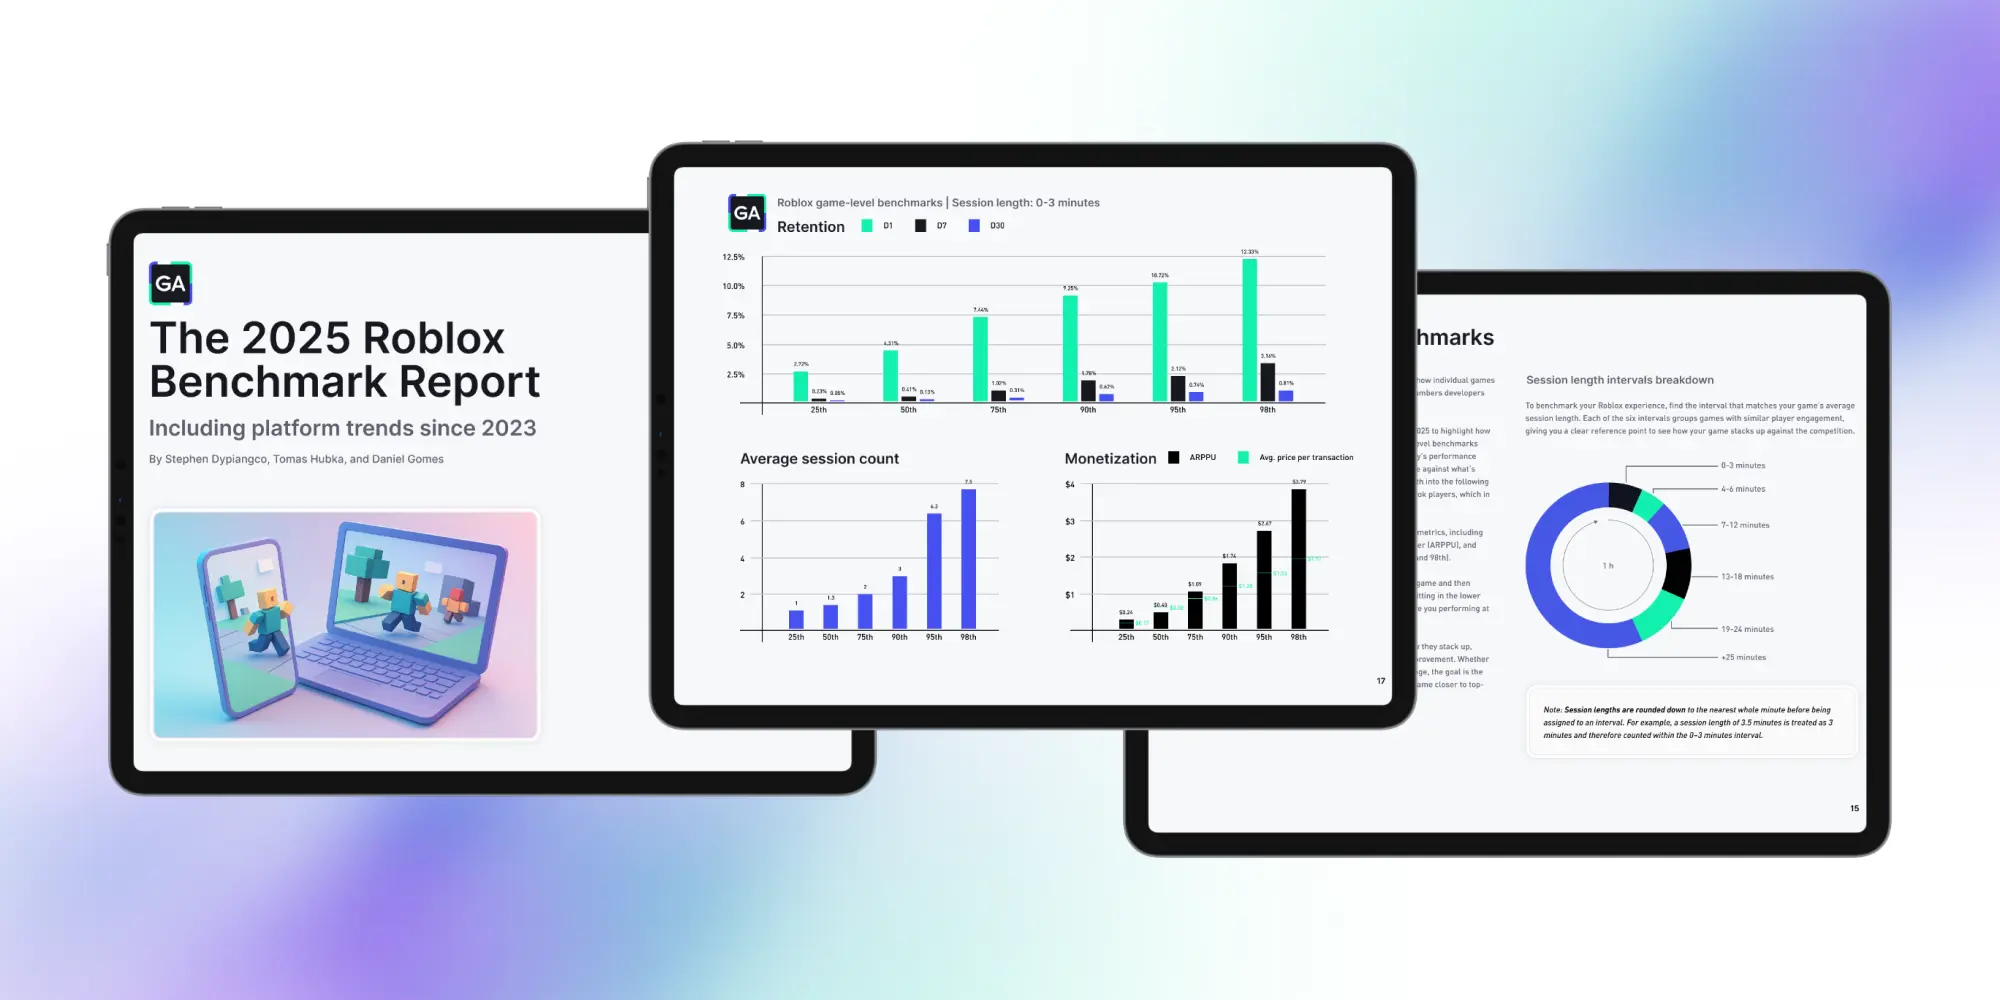
Discover Roblox 2025 benchmarks for engagement, retention, and monetization. This report reveals platform trends and game-level insights to help developers measure success and grow their experiences.
TL;DR
- The platform is polarizing hard between Casual and Core Users. Session length has stretched from a 6x gap in 2023 (4 min vs ~25 min) to nearly 15x by mid-2025 (2 min vs 37+ min), and daily playtime from 10x to over 14x (6.6 min vs 93.8 min) — most players sample and bounce, a minority commit heavily.
- The biggest 2025 shift is return frequency, not longer sessions. Core User cadence jumped 33% year-over-year at both P90 (4.5 → 6.0 sessions/day) and P95 (6.0 → 8.0), driven by re-entry design, offline/idle progression, and Roblox's 2025 algorithm update favoring friend-to-friend co-play.
- Spending is increasingly top-heavy and now tied to discovery. Median payers spend under $1/day while the top 5% clear $20 — a gap that widened from 20x to over 30x. Roblox feeds 7-day spend days per user and 7-day Robux spent per user into recommendations, so monetization and growth reinforce each other.
- Session length works as a maturity ladder. Games at 0-6 min are fragile (D1 under 10%, roughly one session/day, negligible ARPPU); 7-18 min games hold attention but not frequency; 19+ min games are hits, with double-digit D1 across the board, ~2 sessions/day at the median, and ARPPU spiking into the high $20s-low $30s at P95-P98.
- Depth doesn't automatically monetize. The 25+ min tier leads on engagement (median 2+ sessions/day, up to ~7 at P98) but ARPPU is uneven and sometimes below the 19-24 min tier — long sessions are necessary but not sufficient, and monetization design still has to be built deliberately.
Introduction
Roblox is entering a new era of scale and opportunity for developers. The platform continues to expand rapidly: 111.8 million daily active users (DAUs) in Q2 2025, each spending an average of 2.7 hours per day, driving $1.4 billion in quarterly bookings. This growth has been fueled by breakout titles like Grow a Garden, Steal a Brainrot, and 99 Nights in the Forest, which demonstrate both the size of the opportunity and the speed at which new hits can emerge.
But for most developers, two questions remain pressing: How do you create a hit? And how do you systematically improve a game once it is live?
Despite Roblox’s scale, resources to answer these questions are limited. Developers have little visibility into how player behavior trends are evolving across the platform, what metrics define success, or how their own games compare to the broader ecosystem.
This report was created to fill that gap. Drawing on aggregated data from thousands of top Roblox titles, we provide benchmarks across engagement, retention, and monetization. Our goal is to help developers understand where their games sit relative to the market, identify growth opportunities, and apply data-backed strategies to climb the ladder fromearly-stage release to breakout hit.
Methodology
In this report, we analyzed aggregated gameplay data spanning January 2023 through July 2025 from thousands of leading Roblox titles integrated with GameAnalytics (GA) to track their performance metrics. These games represent a broad mix of genres, popularity levels, monetization models, and player bases. The teams that made them range from solo developers to large professional studios.
Our dataset includes thousands of high-traffic experiences attracting more than 1 million monthly active users (MAU) each, collectively driving billions of visits every month on Roblox. While this sample does not cover the entire Roblox ecosystem, it captures nearly half (47%) of total player engagement in games built on the platform, providing a strong, representative view of overall trends.
In the first section, we assess Roblox platform-level data representing player behavior across the GA network. This view covers trends such as daily session frequency, session length, and overall spending distribution. By analyzing engagement and monetization patterns at the platform level, we can highlight how Roblox users as a whole are playing, returning, and spending differently over time.
In the second section, we examine game-level data to create benchmarks that developers can use to measure their own performance. Here we focused specifically on 2025 data to reflect current standards. To make comparisons meaningful, we segment games into session-length intervals (0–3 min, 4–6 min, 7–12 min, 13–18 min, 19–24 min, 25+ min). Each range represents how effectively an experience is able to hook players and sustain engagement, which in turn shapes retention and monetization outcomes. By breaking benchmarks into these intervals, developers can identify where their games sit today and understand the priorities required to progress to the next tier.
No individual game data is disclosed. Instead, this report focuses on aggregated benchmarks and patterns to highlight key trends in player behavior and game performance. Our aim is to surface actionable insights that can help Roblox developers, publishers, and anyone interested in the platform better understand what’sdriving success.
Throughout this report, “Casual Users” refers to players in the bottom quartiles of engagement (shorter sessions, few repeat visits), while “Core Users” refers to those in the top quartiles (longer sessions, multiple daily visits, higher spending).
Key takeaways
Roblox player behavior trends
Roblox player behavior has shifted meaningfully over the past two years. Looking at platform-wide engagement and monetization data from January 2023 to July 2025, three trends stand out:
- Players return repeatedly: Half of players log in multiple times a day, with the most active Core Users hitting up to 8 sessions daily.
- Engagement is polarizing: Casual Users leave the experience in under 2 minutes, while Core Users average 37 minutes per session, displaying a 15x gap.
- Spending is top-heavy: Median payers spend less than $1, while the top 5% are now over $20 per day, more than 30x higher.
Why this matters: Roblox is increasingly split. Most players dabble for just a minute or two, while a smaller core drives the bulk of time and revenue. Developers need both: sharp hooks to catch Casual Users and deep systems to retain the Core Users fueling growth and monetization.
Roblox game-level benchmarks
Looking across Roblox games grouped by average session length, the data shows a clear progression from fragile early-stage titles to fully mature hits. Three themes emerge:
- Short-session games (0-6 minutes) struggle to survive: Daily sessions rarely exceed one per user, retention falls below 10% on Day 1, and monetization barely registers. These games are losing players before they’ve even had a chance to engage.
- Middle-range games (7–18 minutes) show promise but need repeat play: Session length is healthy, but frequency remains low. These games must evolve from “fun once” to “habit-forming” through daily loops, co-play systems, and reasons to return.
- Hits emerge at 19+ minutes: Retention jumps into double digits, daily sessions climb, and monetization spikes dramatically (with whales spending $20–30+). At this stage, the challenge is not proving appeal but sustaining growth and tuning monetization without burning players out.
Why this matters: These benchmarks give developers a clear ladder to climb. Each rung comes with different priorities: first comes hook and onboarding, then repeat play, and finally scaling retention and monetization. Understanding where your game sits on this spectrum and focusing on the right problem for that tier is the difference between fizzling out and breaking into Roblox’s top charts.
Roblox player behavior trends
Jan 2023 - July 2025
Creating a hit Roblox game starts with understanding the player base, the millions of people worldwide who log in daily to discover, play, and connect. In this section, we will break down over two and half year’s worth of data on where players are most often accessing Roblox, how much time they spend in games, and the spending patterns we see across the platform.
The figures you’ll see here are drawn from aggregated data across Roblox games that use GA for tracking and insights. Games outside the GA network are not included. While this dataset represents only part of the Roblox ecosystem, it covers a substantial and diverse share of player activity, offering a meaningful snapshot of platform-wide behavior.
Devices players use
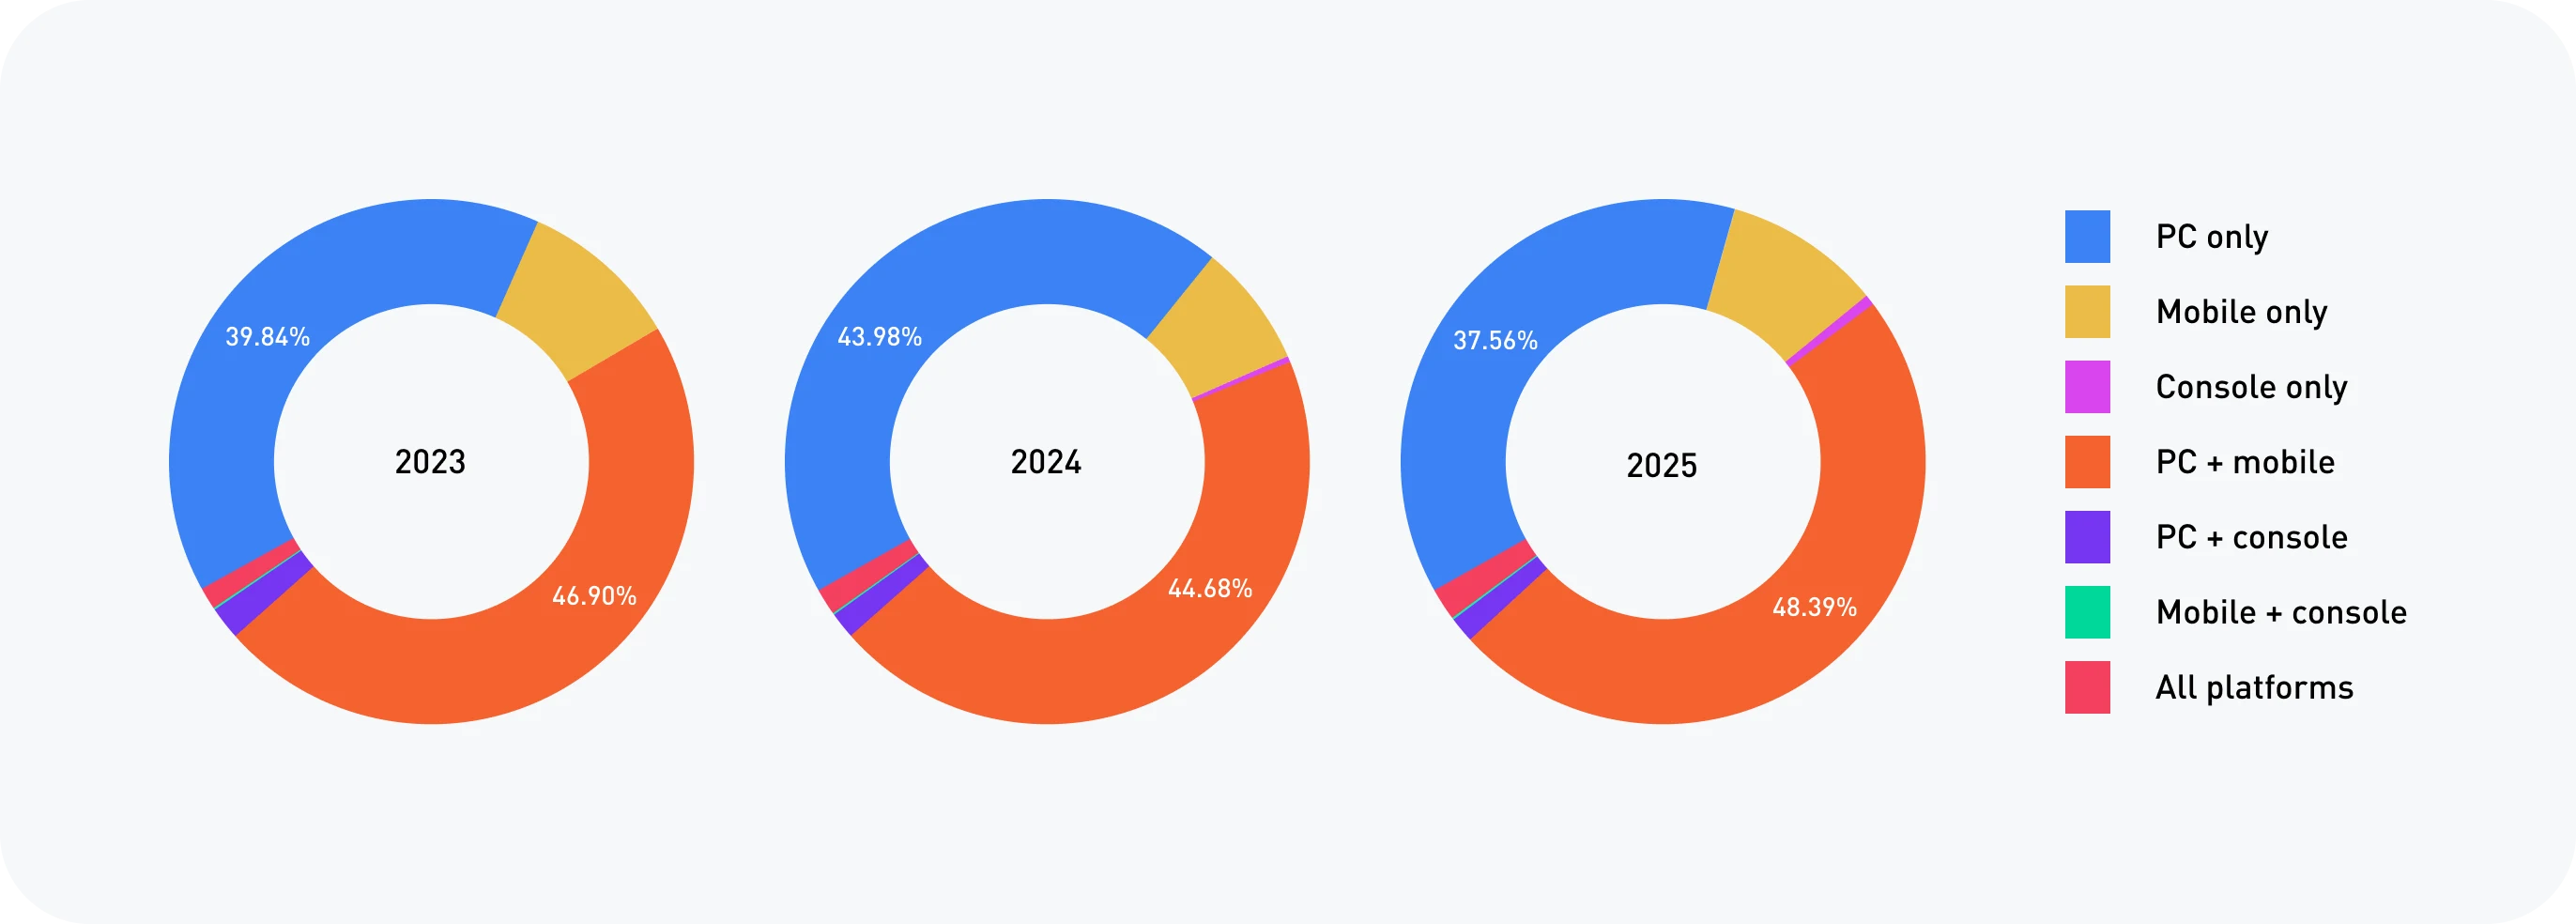
Roblox is played across desktop, mobile, and console, and how players access the platform has not shifted dramatically between 2023 and mid-2025. The dominant group remains those who split their time between PC and mobile, making up nearly half of the players in our dataset. This fluid behavior suggests players are device-agnostic, such as starting on desktop and continuing later on mobile.PC-only players make up the second-largest group, followed by mobile-only players. While there’s been some fluctuation, PC-only rose in 2024 before dipping back in 2025, and mobile-only has remained in the 7–10% range. The balance between these two groups has stayed relatively steady.Console play has inched upward from almost negligible levels in 2023 to just about 2% of the player base in 2025. While that’s growth in relative terms, it’s still a small slice overall, and console should not be a priority for most developers.For developers, this means a few clear takeaways.
- Optimize for both PC and mobile: Since most players are engaging on both, your game should feel seamless whether someone is on a high-end desktop or a low-end phone. That means ensuring UI scales cleanly, controls work intuitively across devices, and performance is stable in a mobile environment.
- Do not ignore desktop players: Despite Roblox’s reputation as “mobile-first,” PC-only users remain a large and consistent group.
- Console optimization is optional: The effort to optimize is unlikely to make or break your game’s success, unless Roblox itself starts heavily promoting console play.
Roblox players continue to treat the platform as cross-device, flexible entertainment. Developers who respect that fluidity, making it easy to pick up and play anytime, anywhere, will be best positioned to capture long-term engagement.
Daily session frequency per user
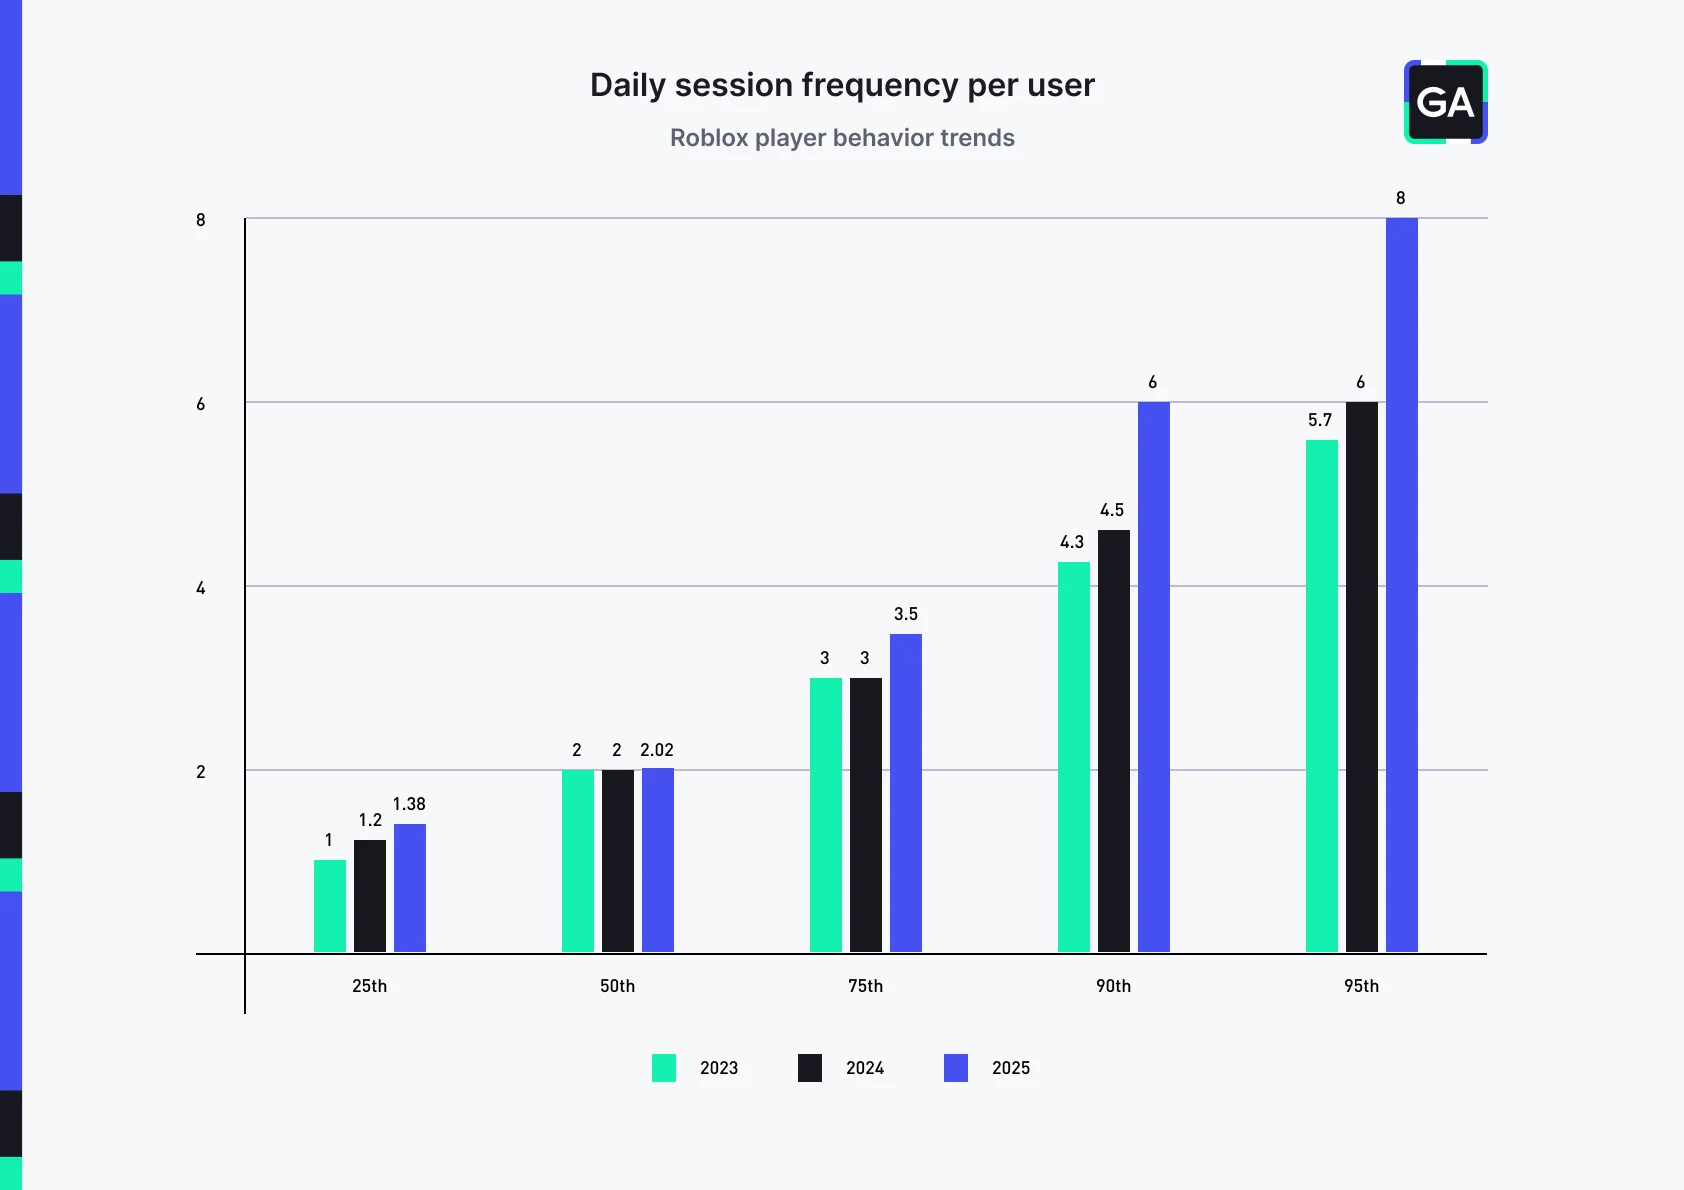
Roblox’s audience does not typically show up to the platform once per day and grind for hours consecutively; rather, they drop in and out. That pattern has held across 2023 to July 2025, and it’s getting stronger. Half of the players in our sample visit at least twice per day, and a quarter (75th percentile) are coming in about three times per day. What’s changed most is the Core User cadence: the 90th percentile climbed from 4.5 to 6.0 sessions/day year-over-year (+33%), and the 95th percentile from 6.0 to 8.0 (+33%). In other words, Roblox’s most engaged players are logging off and back on much more frequently thanlast year.This daily multi-session behavior helps explain platform-level playtime (Roblox has reported ~2.4 to ~2.7 hours/day on average) where time accrues across several short bursts, not one continuous session. It’s easy to imagine someone playing after school or work, during a break, returning before or after dinner, then coming back at bedtime. Collectively, this adds up to meaningful daily engagement.But why are we seeing such a significant uptick in 2025, especially at the top? We see several forces at work:
- Sharper re-entry design: Developers are getting better at moment-to-moment pullbacks: daily quests, time-gated rewards, rotating shops, and micro-objectives that “complete in 3–7 minutes.”
- Offline/idle progression: Newer systems reward you for coming back soon, not just “tomorrow”: resources finish crafting, timers complete, NPC tasks resolve. Even a short AFK window makes the next login feel valuable, encouraging multiple same-day check-ins.
- Intentional co-play: Roblox’s own algorithm update in 2025 is amplifying games that drive friend-to-friend invites and purposeful group play. Roblox says friends playing together produce sessions that are stickier: players stay longer, spend more, and return more often. Developers at the top are designing for this. Whether that’s shared goals (beat a level together), accelerators (get boosts from teaming up), or co-op progress that feels better with allies than solo.
Here are practical takeaways for building your experience:
- Design for bursts: Make sure a 3–7 minute session has a clear goal, progress, and a reason to return later the same day.
- Stage your timers: Stagger timers across minutes, hours, and day cycles, so there’s always something “about to pop.
- Surface progress on entry: If leveraging offline progression, lead with “what completed while you were away” to convert quick logins into satisfying wins.
- Build with friends in mind: Incentivize players to bring others along and make co-play the optimal path, not just an optional bonus.
Casual Users are returning a bit more often, but Core Users are returning a lot more often. The winners in 2025 are the experiences that respect short attention windows, pay off micro-sessions, and double down on social design, so the next return session within hours feels even stronger when it happens with friends - not just alone.
Average daily session length per user
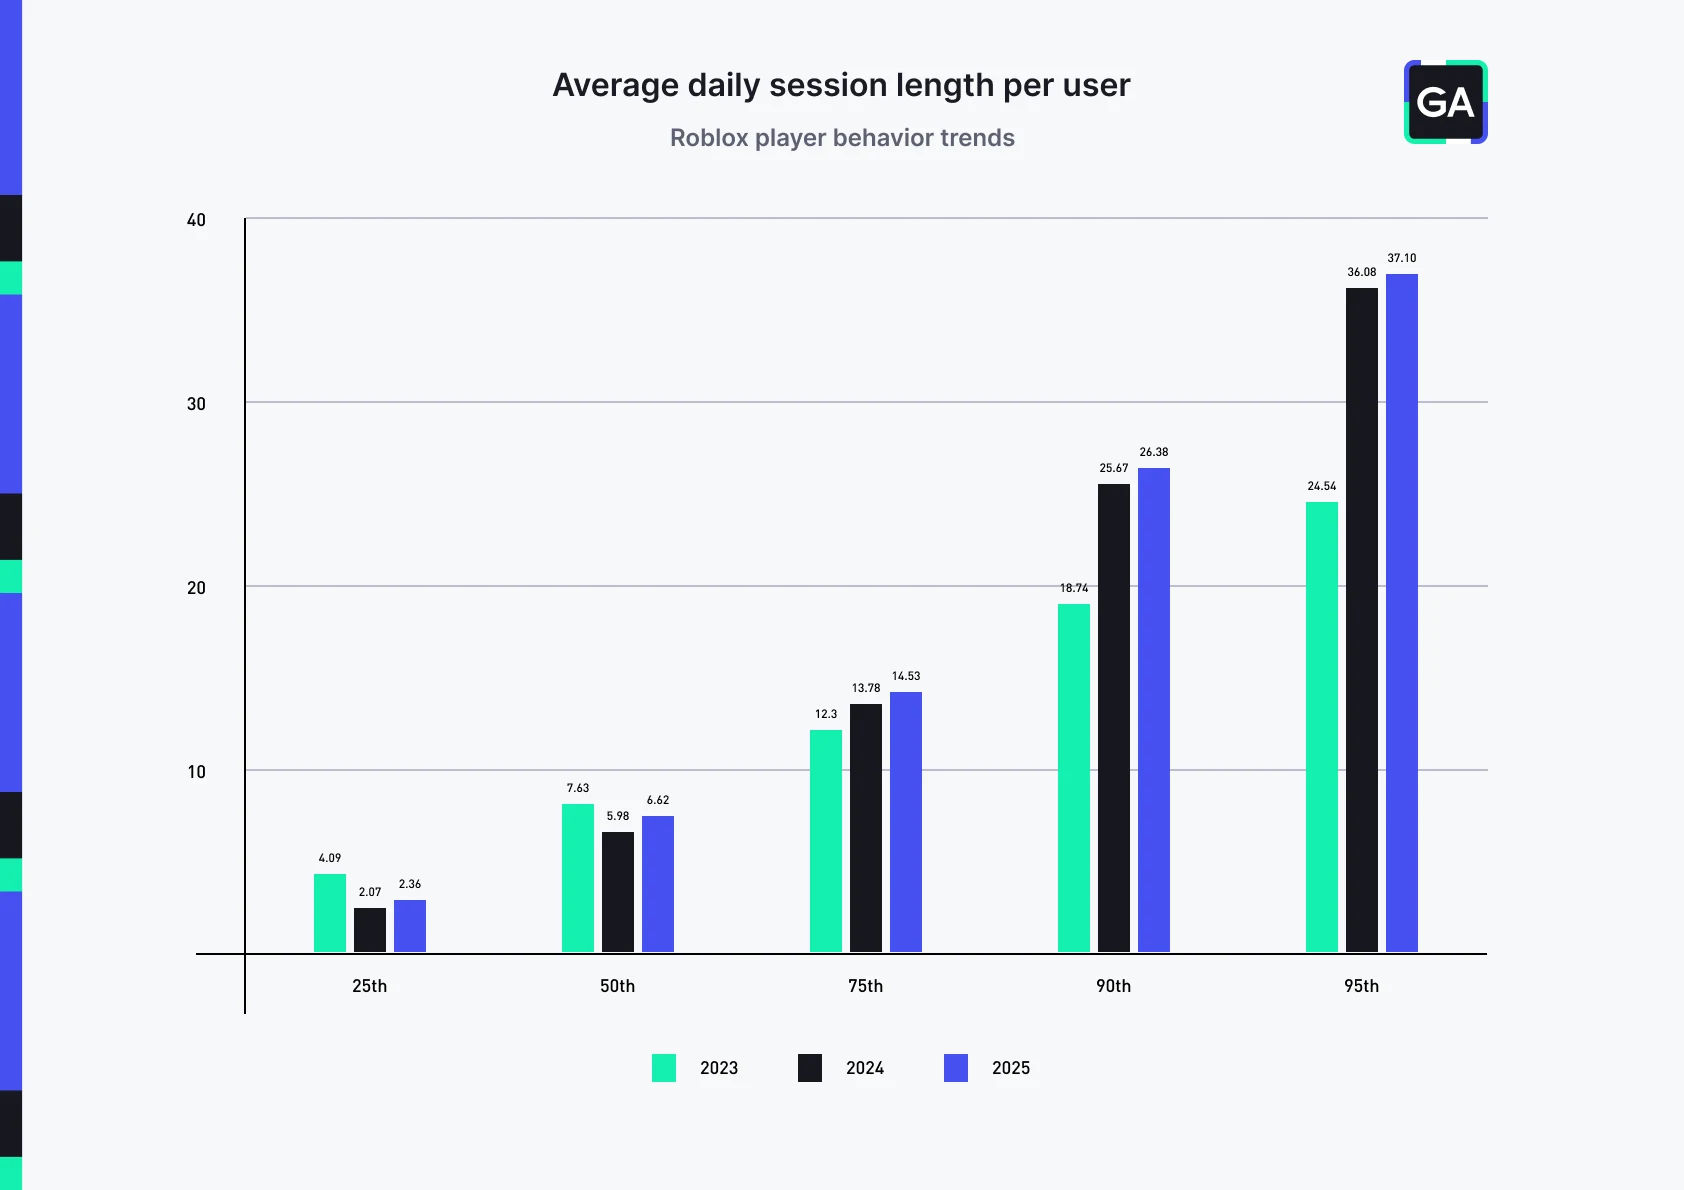
The distribution of Roblox session times is widening. Back in 2023, the 25th percentile user averaged about 4 minutes per session, while the 95th percentile stretched to ~25 minutes, which is a 6x gap. By mid-2025, the short end has compressed further (2 minutes), while the high end has expanded (37+ minutes). The result: a near 15x gap between Casual and Core Users.This data highlights two diverging behaviors:
- At the bottom, Casual Users are trying a game briefly, not finding immediate fun or payoff, and bouncing out within a couple of minutes. These users likely overlap with Roblox’s broader “sampler” audience (the players who hop into a title, test it, and leave if it does not click right away).
- At the top, Core Users are locking into sessions that last well over half an hour. These are the fans who not only find the gameplay loop compelling, but also experience deeper retention drivers like co-play, progression systems, or competitive grinds.
It’s important to re-emphasize that GA does not cover every Roblox game, so this data is not a complete platform picture. But the split is clear: the games that fail to hook fast are leaking players after just a minute or two, while the games that succeed are getting rewarded with long, immersive sessions from their best users.For developers, here are practical lessons:
- Win the first two minutes: If players cannot figure out what to do or do not see progress immediately, they are gone. Clear onboarding, immediate feedback, and a “mini-goal” that can be completed right away are table stakes.
- Design for depth: Your Core Users are proving they will stay 30+ minutes if the loop sustains them. Build layers of progression (mechanical mastery, cosmetic unlocks, social systems) that unfold over time rather than peaking too early.
- Segment your systems: Do not try to force every user into the same path. Some will only ever give you a 2-minute look; others will grind for an hour. Have “shallow wins” for the Casual Users and “deep hooks” for the Core Users so both ends of the curve are served.
- Measure bounce explicitly: Use analytics not just for average time but for drop-off points. If 25th percentile players consistently leave at 2 minutes, identify what they are encountering, or not encountering, at that exact moment.
The Roblox ecosystem is polarizing. A large casual layer is still sampling and bouncing fast, but the upper end is pushing into sustained, multi-dozen-minute sessions. The studios that thrive in 2025 are those that capture value from both ends: immediate payoff for Casual Users, meaningful depth for the Core Users.
Total daily playtime per user
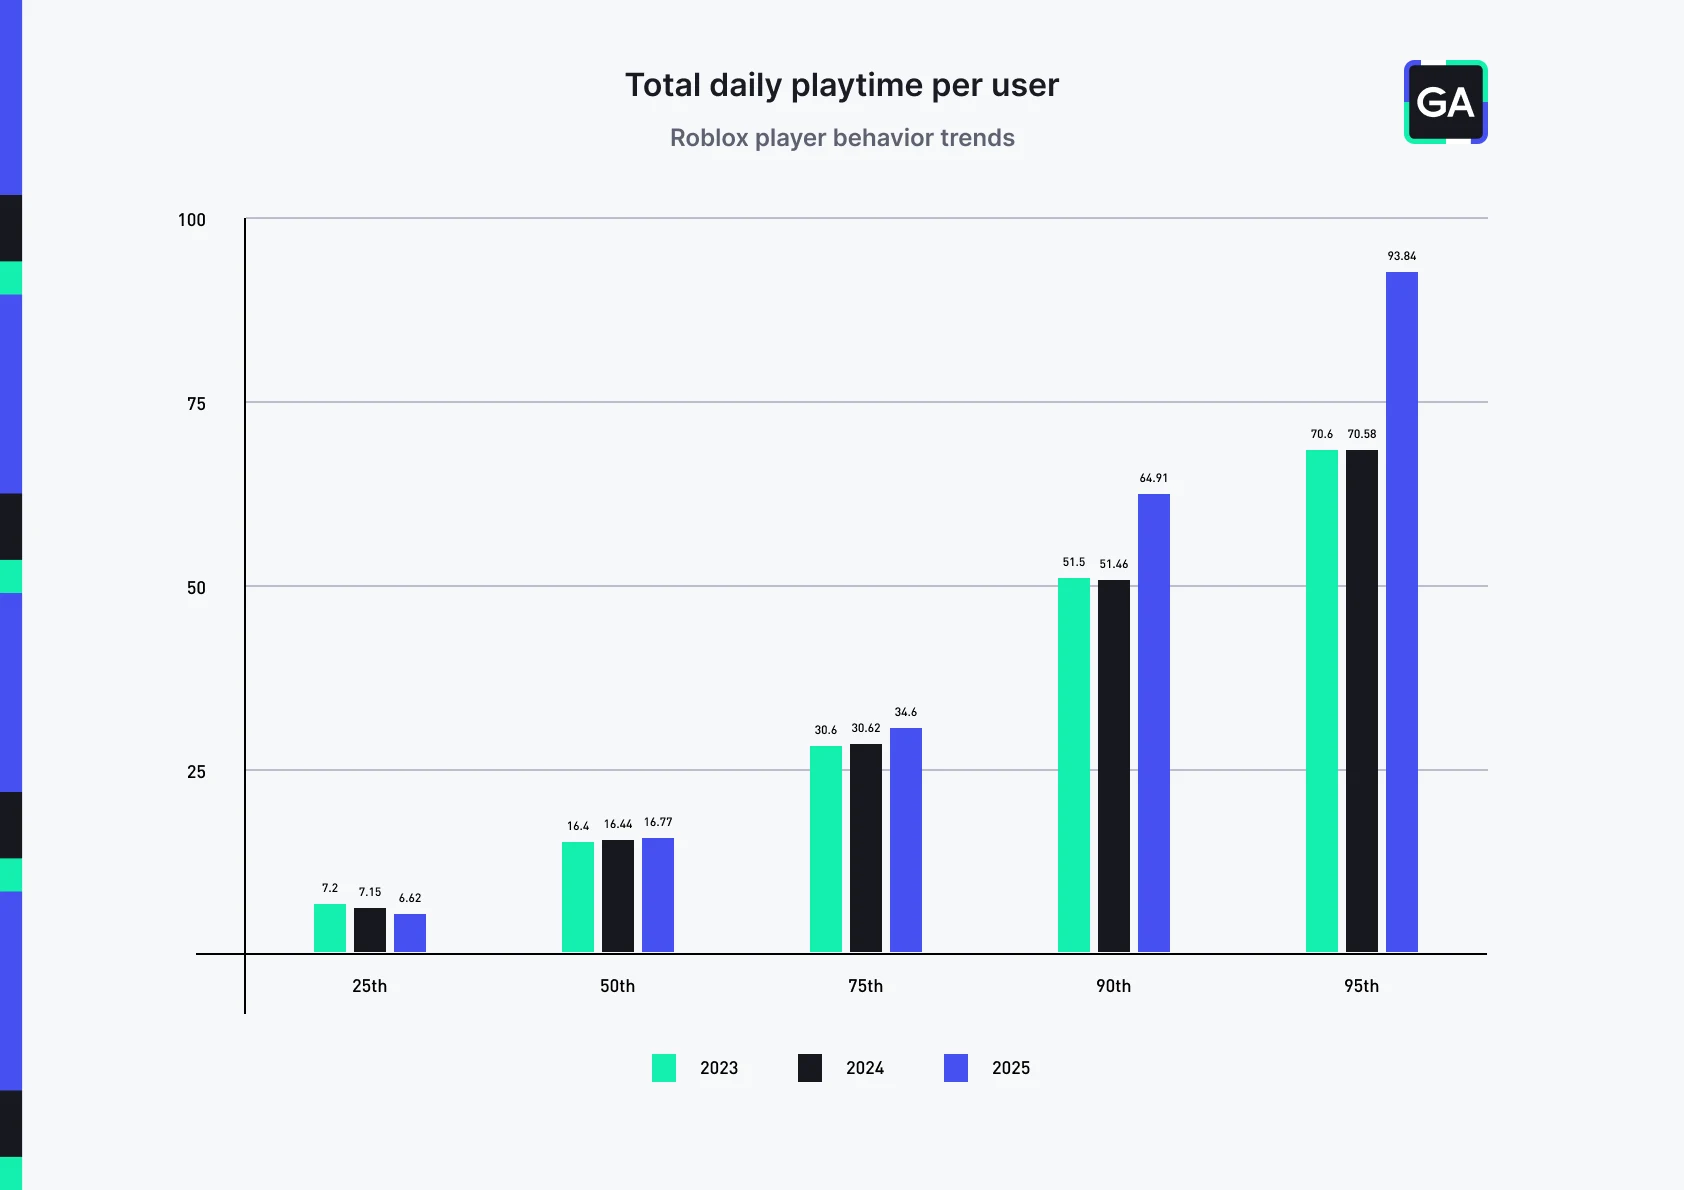
In 2023, the gap between the bottom 25% of players and the top 5% was already stark: 7 minutes vs. 71 minutes per day, a 10x difference. By 2025, that spread has exploded to 6.6 minutes vs. 93.8 minutes, more than 14x more. The Casual cohort is heading towards shorter daily play, while the most dedicated Core Users are pushing well past an hour and a half every day.What’s notable is how flat the metrics were from 2023 to 2024. The surge did not come until 2025, when the top end broke away from the rest of the distribution. This was not just longer sessions; it also reflected more frequent daily returns, with Core Users stacking multiple play sessions to reach 60–90+ minutes.This aligns with broader platform trends: offline progression systems pulling players back to check in, co-play loops encouraging friends to log on together, and games that quickly hook Casual Users so that some convert into repeat visitors. Even though this dataset only covers games using GA (and excludes browsing or marketplace activity), the directional trend is clear: Roblox is polarizing between Casual User dabblers and Core User daily diehards.For developers, the key takeaways here are about designing for multiple daily touchpoints, not just maximizing one session:
- Create reasons to come back: Use streaks, timers, daily rewards, and co-op mechanics that naturally draw players back into the game at least twice a day.
- Offer short, modular loops: Create “check-in” actions that take 2–3 minutes (check offline progress, claim rewards, see if there are new items available for purchase) so players can slot your game into spare moments.
- Leverage co-play to trigger returns: Systems that depend on squads, parties, or asynchronous challenges turn one player’s return into a group return.
- Design rhythms across hours: Some systems should resolve on a scale of hours, not days, to create urgency for multiple visits within one day.
- Optimize for daily totals: Track not only session averages but also total daily playtime. A 12-minute game that players open 5x a day beats an 18-minute game they open once.
Roblox’s growth story in 2025 is about denser daily play, not just longer single sessions. The top games are structuring experiences that turn players into multi-session, daily repeaters, and that is where developers should focus their design energy.
Average revenue per paying user
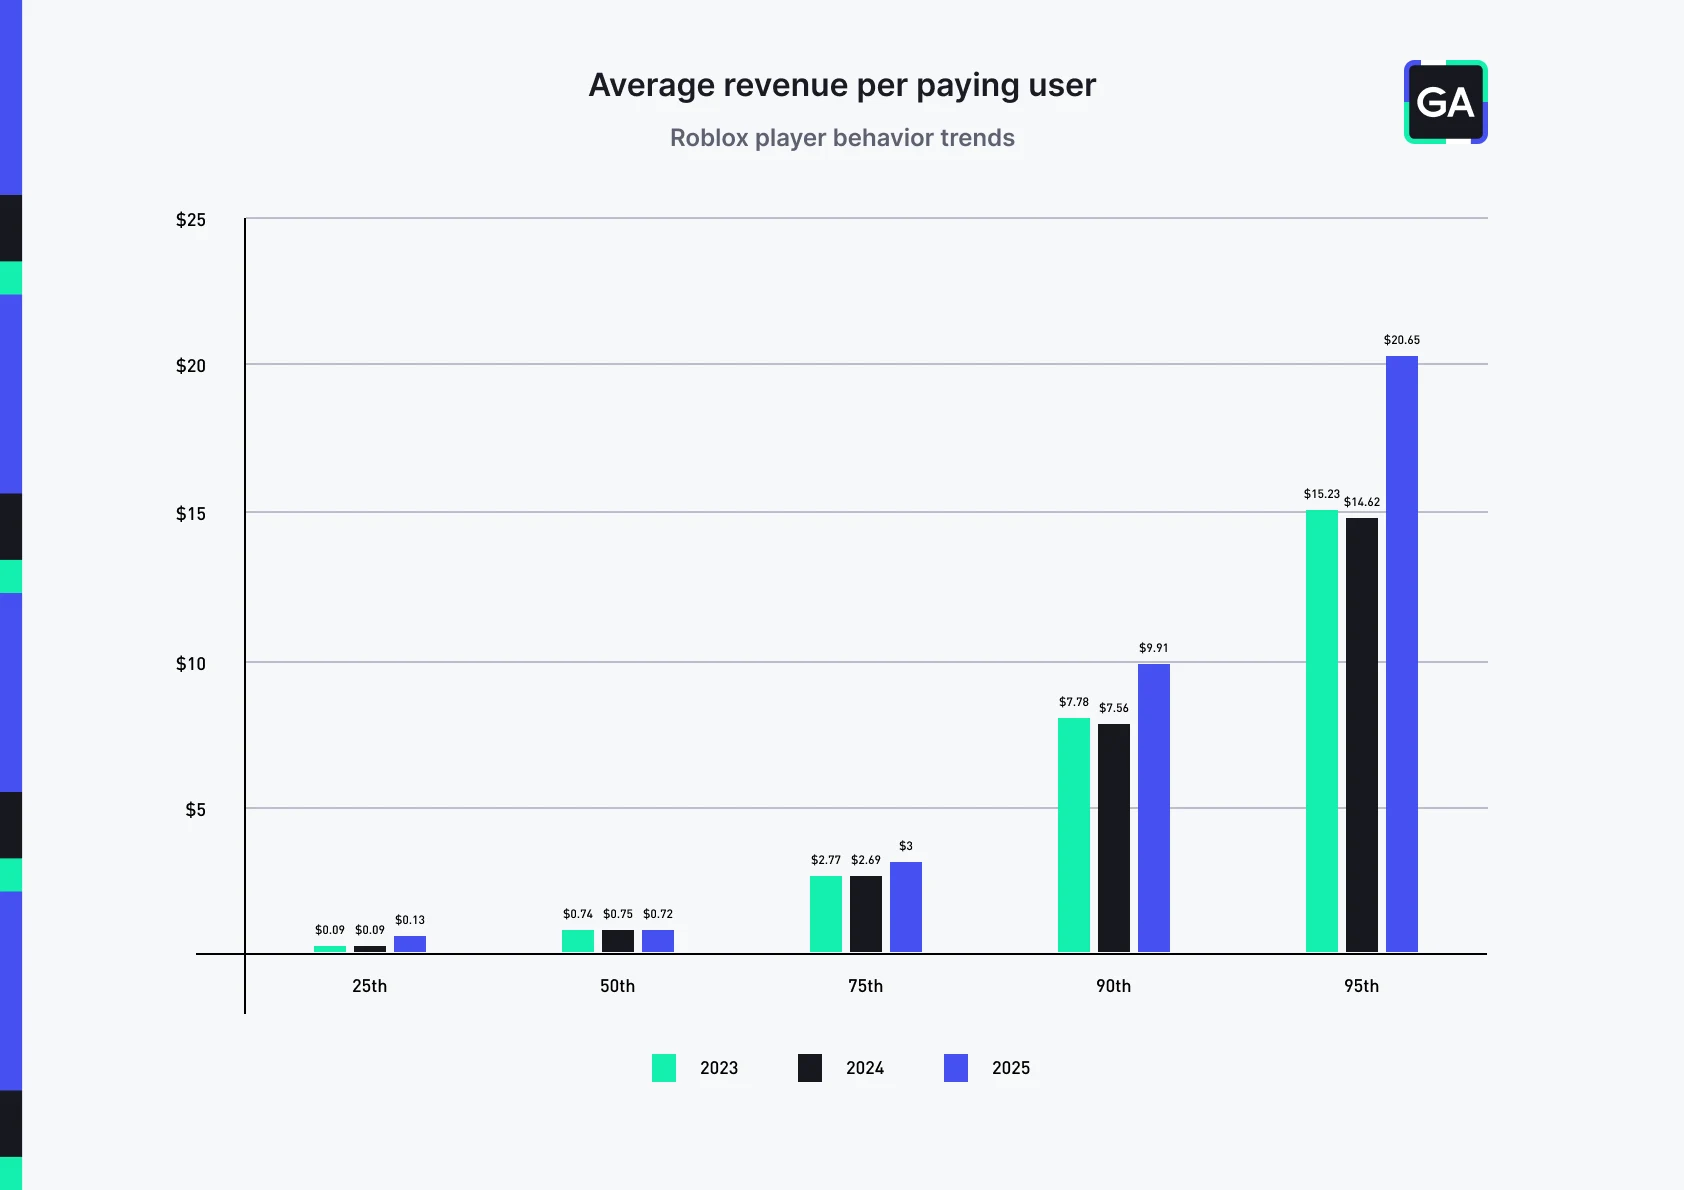
GA data shows just how massive the spending gap is between Roblox’s most casual payers and its whales. In 2023, the top 5% of payers were spending around 20x more per day than the bottom 50%. By 2025, that gap has ballooned to more than 30x, with whales now spending north of $20 per day while the median payer is still under a dollar. The median values have not budged much, but the highest-value players are climbing sharply. Roblox’s payer economy has become increasingly top-heavy, resembling the extreme power-law dynamics seen in mobile F2P at scale.This shift matters not just for revenue, but for how the Roblox platform itself rewards games. Roblox has stated that two monetization metrics feed directly into discovery and recommendation:
- 7 day spend days per user: Total unique days users spend Robux in your experience over the last 7 days.
- 7 day Robux spent per user: Total Robux spent per user in your experience over the last 7 days.
In other words, the platform does not just look at whether players spend but it looks at how often and how much they spend over time. Games that encourage players to make repeat purchases across multiple days and raise their overall spending per week, gain an advantage in Roblox’s recommendation system. Monetization and discoverability are now tightly linked: games that monetize better are also more likely to grow.Developer takeaways:
- Design for whales: Most players will never spend more than a dollar or two. The real opportunity lies in building high-value offerings (premium cosmetics, powerful but fair progression boosts, status items) that appeal to the top 10% of spenders.
- Do not neglect small spenders: While whales carry revenue, first-time purchases often start small (under $1). Make it easy for new payers to convert, then escalate with tiered offers.
- Monetization loops must reinforce engagement loops: A strong ARPPU game is not just selling power, it’s tying purchases to reasons to log back in. Currency packs, progression accelerators, or new features all encourage repeat spend.
- Optimize for recurring spend: With Roblox’s 90% monthly repurchase rate platform-wide, the expectation is that payers keep buying. Consider renewable offers (weekly bundles, battle passes, weekly events) rather than one-time purchases.
- Track monetization metrics Roblox rewards: If you can raise your 7-day spend days per user and Robux spent per user, you improve both monetization and discoverability - a double benefit.
Roblox in 2025 is a top-heavy spender economy. Developers who can convert casuals while also giving whales compelling reasons to keep spending will not only earn more, they’ll get pulled upward by the platform itself.
Roblox game-level benchmarks
Now that we’ve covered Roblox at the platform level, let’s zoom in on how individual games are performing. This section provides game-level benchmarks: the numbers developers can use as reference points when evaluating their own titles.
In the previous section, we looked at data from January 2023 to July 2025 to highlight how player behavior has evolved over time. Here, we shift focus to game-level benchmarks based solely on 2025 data. This approach gives you a snapshot of today’s performance standards, making it easier to benchmark your own Roblox experience against what’s happening right now. To add more context, we’ve broken session length into the following intervals since each range reflects how strongly an experience can hook players, which in turn influences key metrics like retention and monetization.
Within each engagement range, we’ve broken down key performance metrics, including daily sessions, retention (D1, D7, D30), average revenue per paying user (ARPPU), and average transaction price, by percentile (25th, 50th, 75th, 90th, 95th, and 98th).
This structure allows you to find the category that best matches your game and then benchmark yourself against the broader Roblox ecosystem. Are you sitting in the lower quartiles, suggesting there’s significant room for improvement? Or are you performing at the 75th percentile or above, signaling competitive strength?
The benchmarks are designed to be practical: developers can see how they stack up, identify where the gaps are, and take away targeted strategies for improvement. Whether your game sits in the shorter-session buckets or the long-session range, the goal is the same: use these benchmarks to set informed targets and push your game closer to top-performing status on Roblox.
Session length intervals breakdown
To benchmark your Roblox experience, find the interval that matches your game’s average session length. Each of the six intervals groups games with similar player engagement, giving you a clear reference point to see how your game stacks up against the competition.
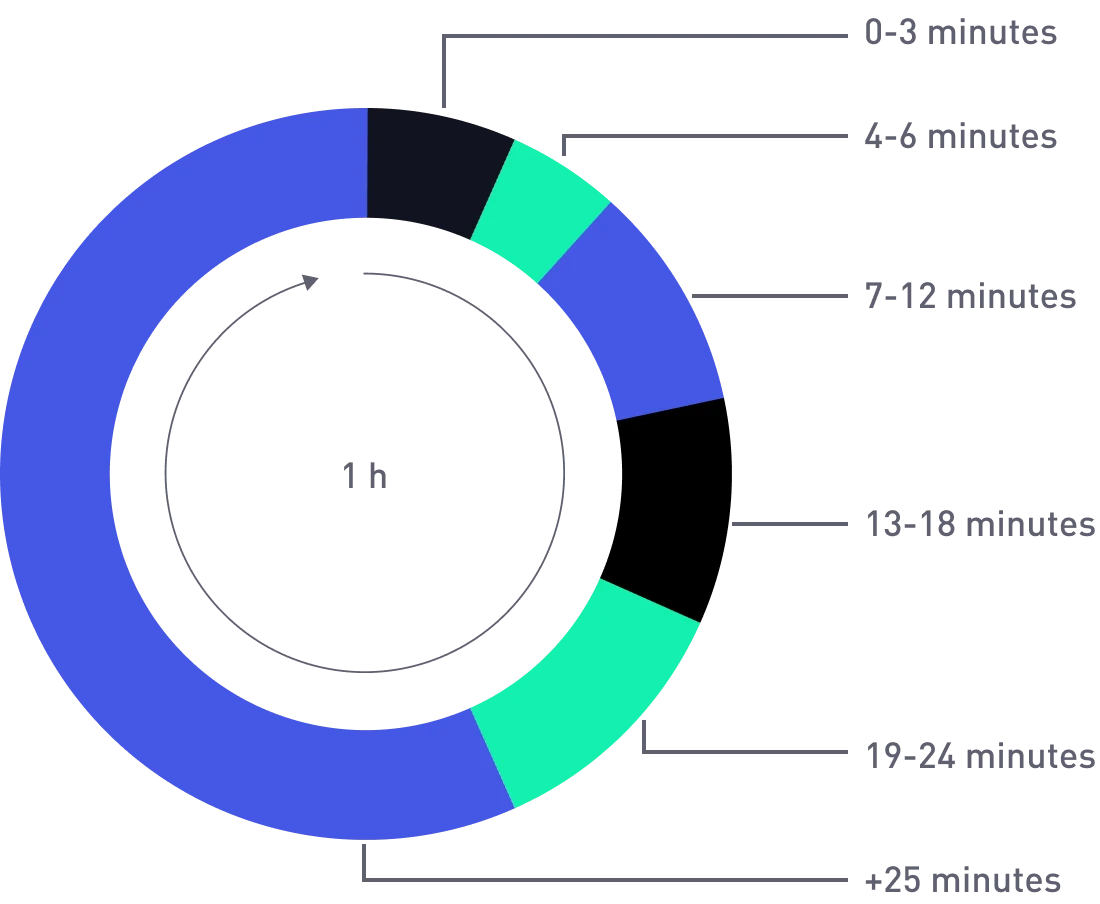
Note: Session lengths are rounded down to the nearest whole minute before being assigned to an interval. For example, a session length of 3.5 minutes is treated as 3 minutes and therefore counted within the 0–3 minutes interval.
0-3 minute session length
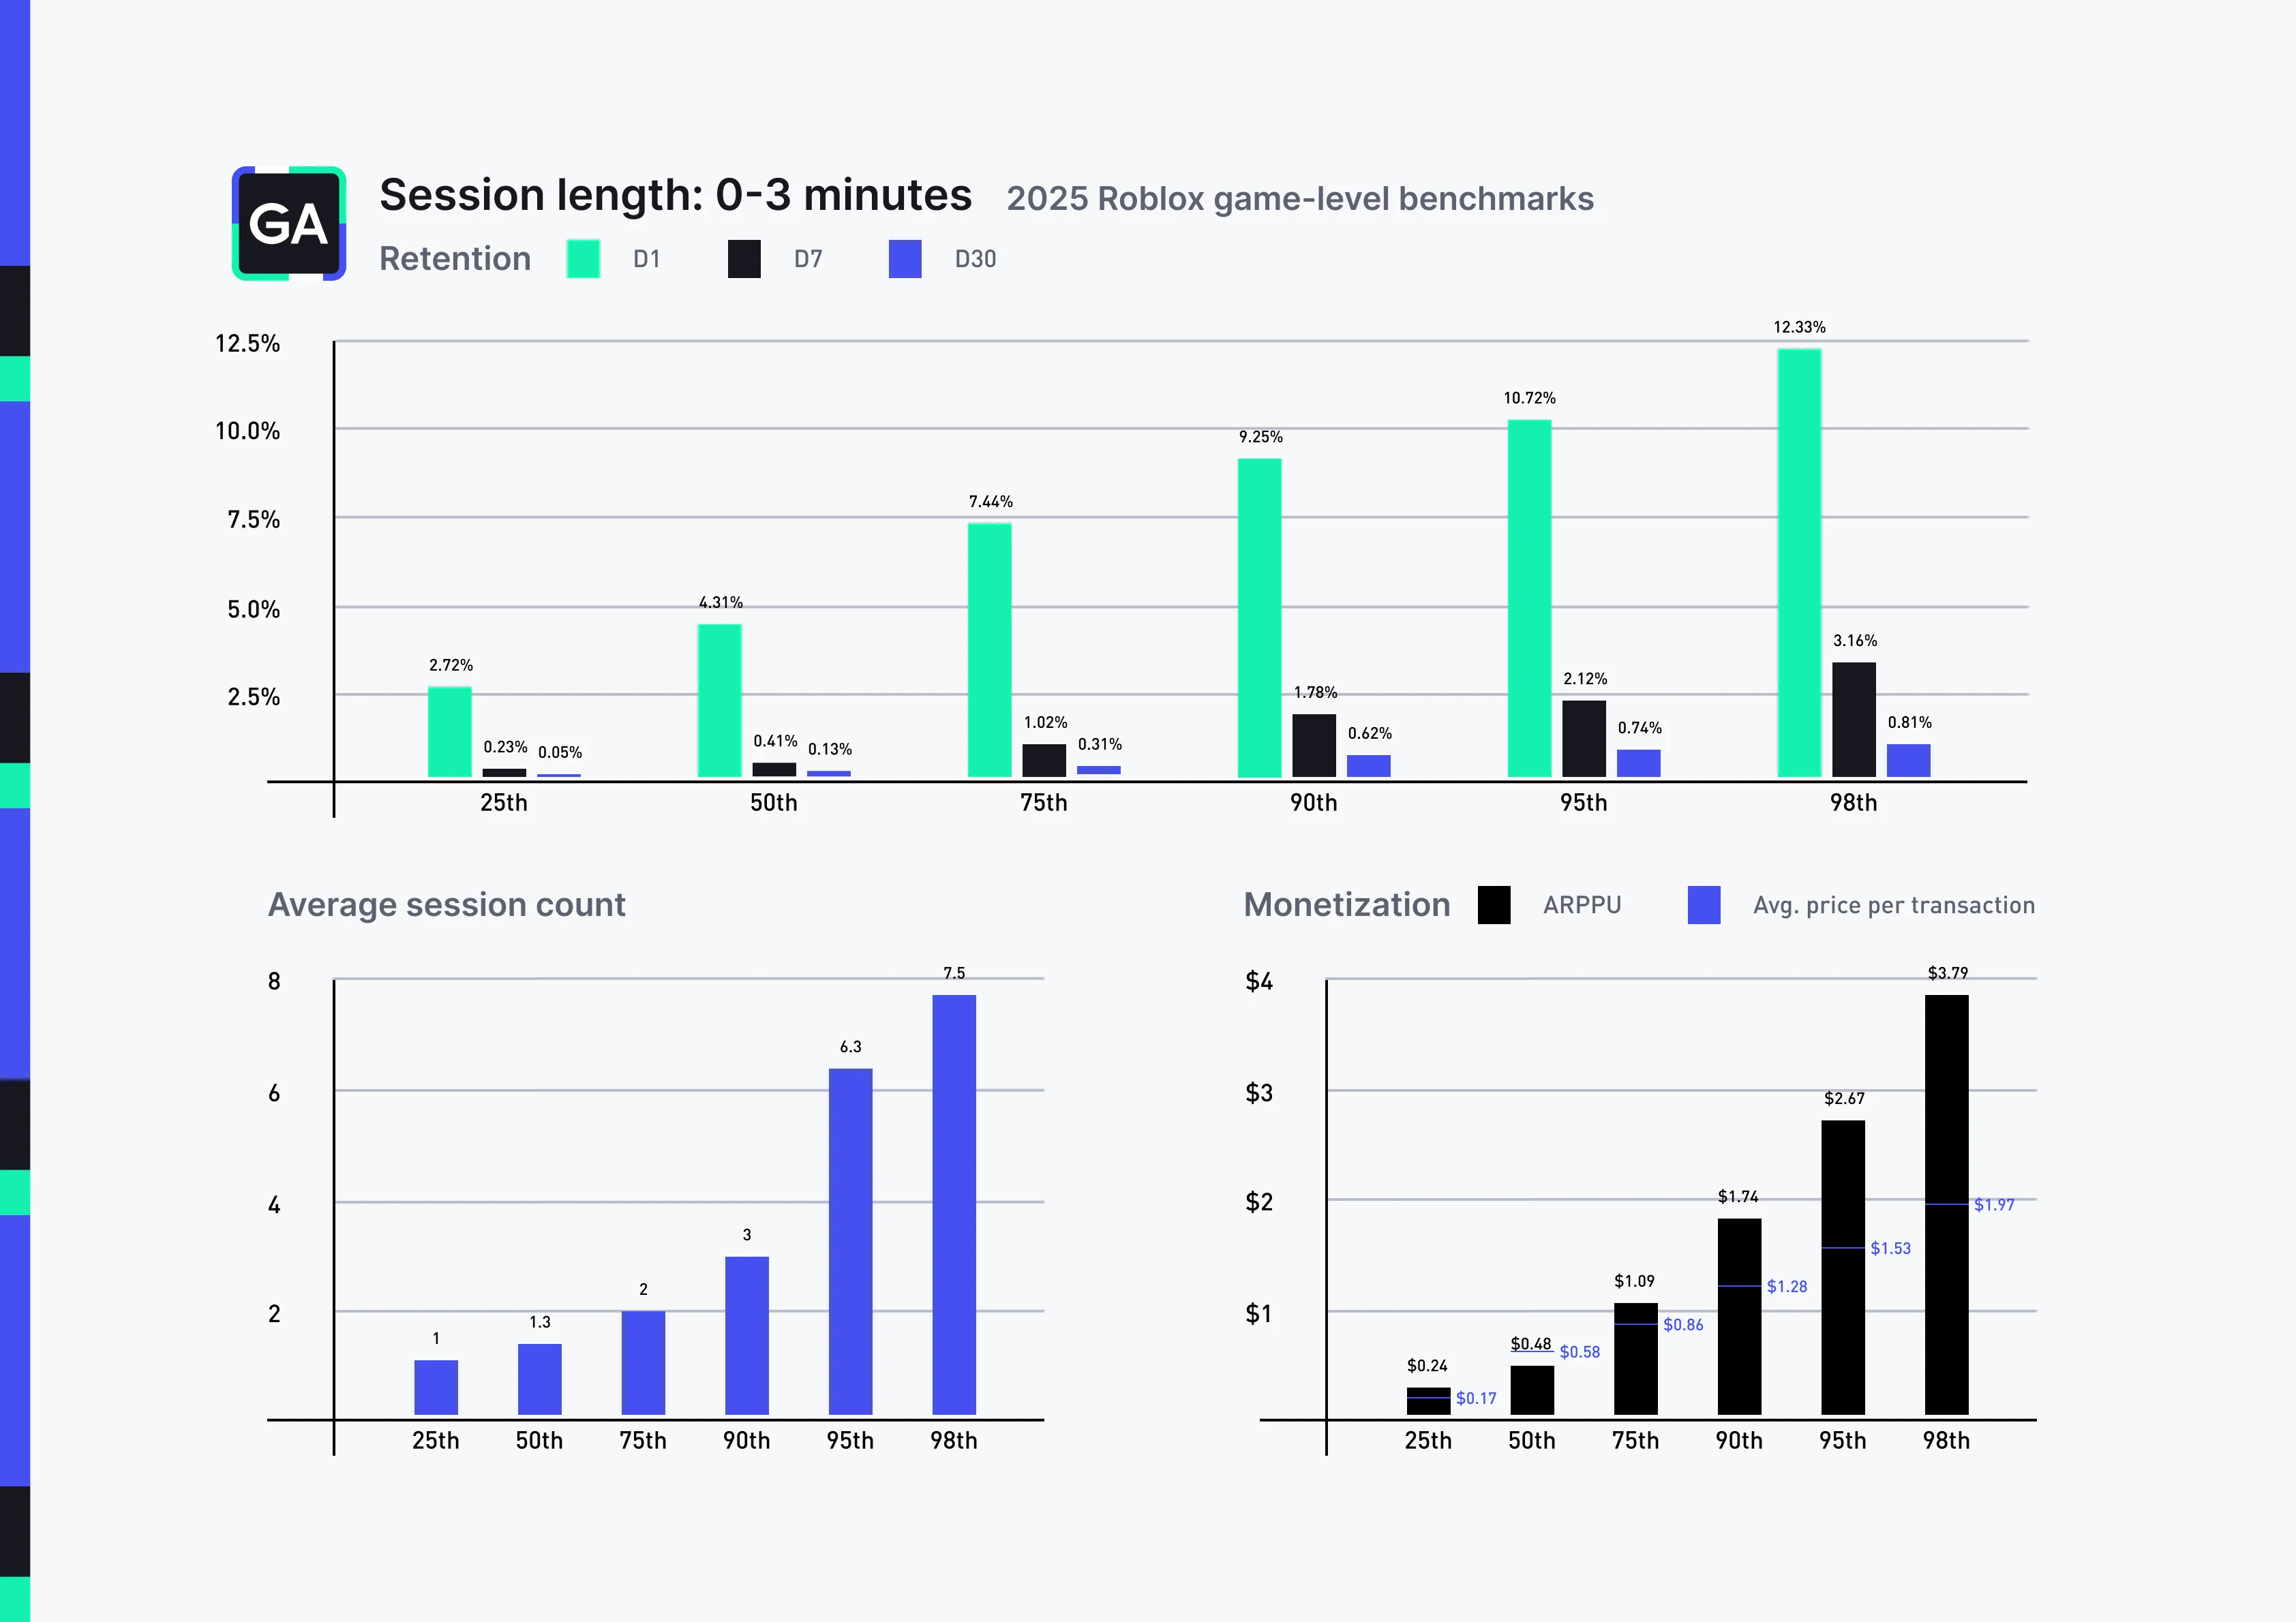
This is the lowest engagement range we’ll look at, and the numbers reflect just how fragile games can be at this stage. Daily session counts tell the story: half of players in this bucket only log into a game once per day, and even at the 95th percentile, activity peaks at just over six times. Contrast this with higher engagement ranges (which we’ll cover later), and it’s clear: games in the 0-3 minute bucket struggle to establish any meaningful loop that encourages repeat logins.
Retention rates are even more telling. At the median, only ~4% of players come back the next day, and even the 90th percentile manages less than 10%. By Day 7, retention plummets below 2% across most of the distribution, and by Day 30 it’s under 1%. For games in this range, the vast majority of players bounce out after one session, and those that do return rarely stick for long.
Monetization follows naturally from these patterns. ARPPU peaks around $5.42 at the 98th percentile, but most games in this bucket see under a dollar. Average transaction values top out at just $1–$2. These numbers confirm what you’d expect: if players do not stay long enough to understand or value the experience, they will not spend.
So what does this mean for developers? The challenge is not monetization. It’s onboarding and the very first moments of play. If you’re in this range, the data suggests you need to focus on the following:
- First 60 seconds clarity: Players should instantly understand what to do and why it’s fun. Avoid long tutorials or complex UI.
- Immediate reward: Give players a win right away, whether that’s a cosmetic unlock, a burst of progression, or a clear sense of power.
- Reduce friction: Long load times, confusing menus, or clunky controls must be avoided. Every extra click is a reason to quit.
- Hook before depth: You do not need to explain every system upfront. Add just enough to get players engaged, then layer in complexity later.
Games in the 0–3 minute grouping have not yet proven their core appeal to players. To escape this lowest level, developers must optimize the very beginning of the player journey. If you can turn those first 180 seconds into something fun, rewarding, and clear, the rest of the metrics (retention, sessions per day, and eventually monetization) will start to climb.
4-6 minute session length
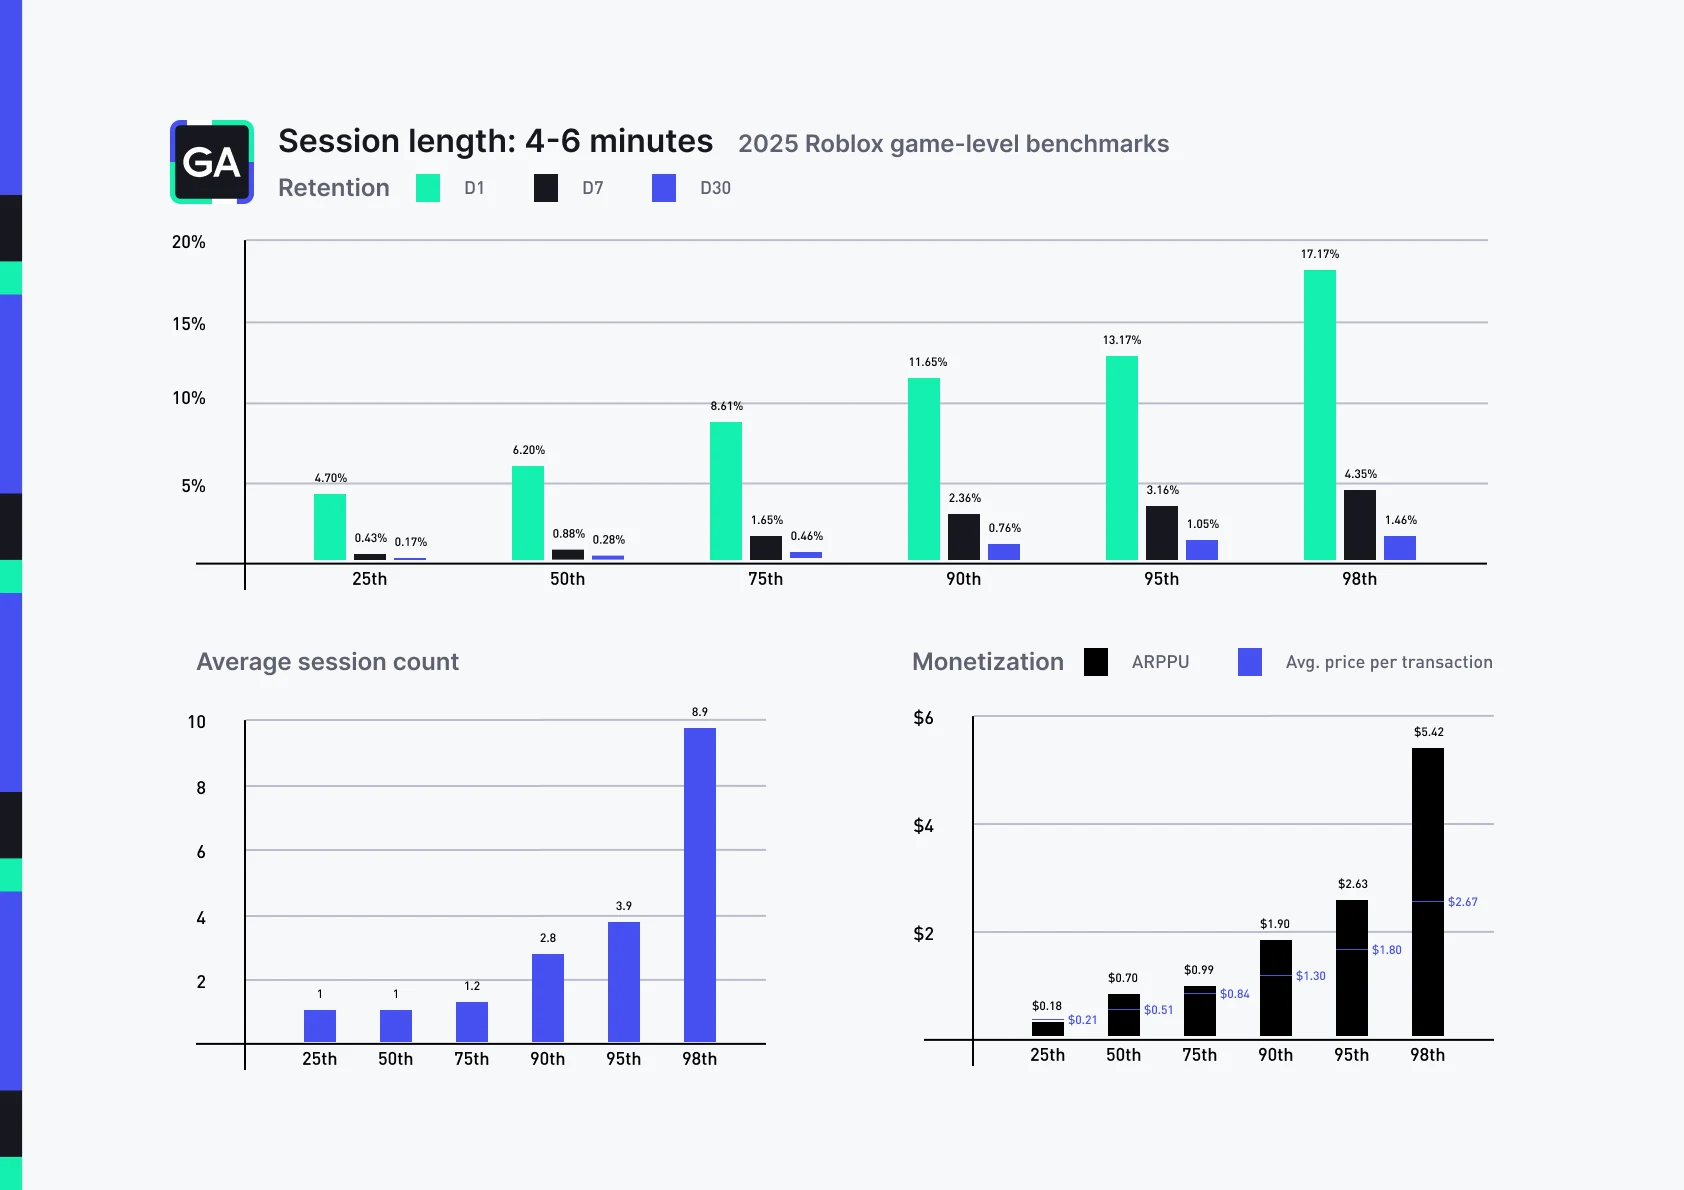
Moving up to the 4-6 minute range, we see incremental improvements compared to the 0-3 minute grouping, but the overall challenges remain. Daily session counts are still low: half of players log in just once per day, and even at the 75th percentile, activity barely rises above 1.2. Only the very top of the distribution (98th percentile) breaks through to nearly nine sessions per day, which suggests that while a small slice of players are finding reasons to return, the majority are not building habits.Retention follows the same story: modest gains, but still fragile. Median Day 1 retention sits just above 6%, climbing to 11–13% for higher-performing games. By Day 7, even the best games in this range hold onto fewer than 5% of their players, and by Day 30, retention drops below 1.5%. This points to a fundamental issue: games in this range may succeed at grabbing attention briefly, but they fail to sustain long-term interest.Monetization reflects the weak engagement curve. ARPPU remains low, generally under $1 for most games, and only the very top reaches meaningful numbers (just over $5). Average transaction prices are modest too, rarely breaking $2 outside of the 98th percentile. Without consistent retention and repeat logins, monetization opportunities simply do not have space to grow.For developers, the lessons mirror those from the lowest engagement tier, with a slightly higher bar:
- Sharpen your hook: A 4-6 minute median session means players are giving you a little more time, but not much. The first minutes still need to be intuitive and rewarding, or players will not stick.
- Build a reason to return: Daily session counts show that most players are not compelled to come back. Stronger daily quests, login rewards, or light progression systems can help establish repeat habits.
- Do not overinvest in monetization yet: Games in this range are not holding players long enough for deep spending mechanics to matter. The focus should remain on retention and engagement loops first.
Overall, games in the 4-6 minute grouping are doing slightly better than those in the 0-3 minute bucket, but the gap between them and higher session length groups remains wide. Success here comes from transforming short curiosity into ongoing play habits.
7-12 minute session length
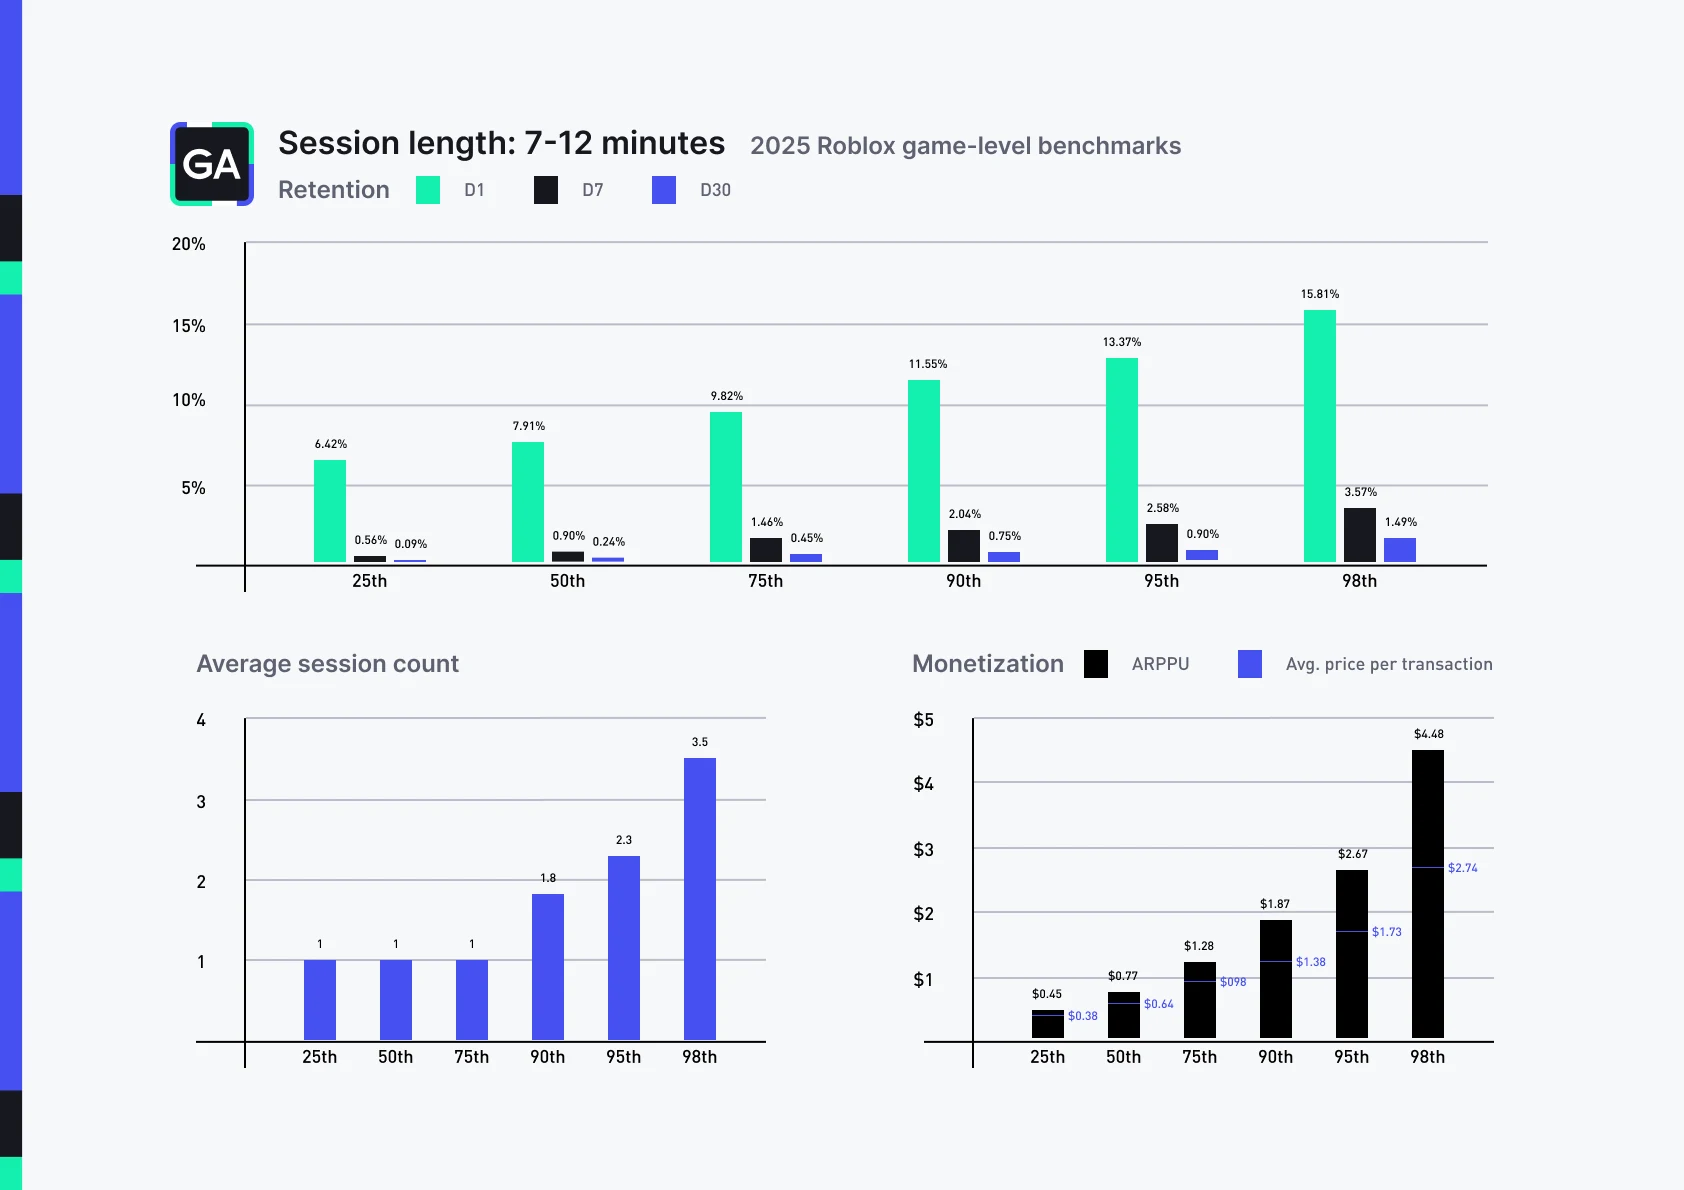
Games in the 7-12 minute session range are clearly doing something right. Compared to the shorter engagement ranges, players here are sticking around longer and showing higher retention, which signals that these experiences are starting to land with their audience. But while this is an encouraging step up, the data suggests these games still have not broken through into “hit” territory.
Daily session counts remain modest. For most players, engagement is still capped at just one session per day, even at the 75th percentile. Only when you reach the very top (90th percentile and above) do you see multiple daily logins, topping out around 3.5 sessions for the 98th percentile. This illustrates that while players are staying longer once they’re in, they are not yet compelled to come back frequently.
Retention is also better, but not yet robust. Median Day 1 retention comes in at nearly 8%, with the top games in this range climbing into the low teens. By Day 7, numbers slide to just under 1% at the median and peak around 3-4% at the very top. Day 30 retention barely cracks 1.5% in the best cases. These figures point to a common issue: players are giving games in this category a fair shot, but they are not finding strong reasons to commit over the long haul.
Monetization reflects this middle ground. ARPPU improves compared to the lowest tiers, with the median hovering around $0.77 and the top of the distribution reaching $4-5. Average transaction prices are slightly higher too, generally landing in the $1-$2 range at the upper percentiles. Still, monetization at this stage is more opportunistic than systematic. Without stronger daily session counts and long-term retention, these gains are limited to a small fraction of players.For developers, the takeaways are straightforward:
- Celebrate the progress: If your game is in this bucket, you’re already outperforming the majority of new releases on Roblox. Players are willing to spend more time with you, which is a critical milestone.
- Focus on repeat play: The gap now is about frequency and stickiness. Daily session counts remain low, which means you need mechanics that draw players back more often: quests, unlockable systems, or co-op features that create social pressure to return.
- Hold off on heavy monetization design: You’re not yet at the stage where deep monetization mechanics will pay off. Instead, polish onboarding, deepen progression, and strengthen social loops. Monetization will come more naturally once engagement habits are in place.
Overall, games in the 7-12 minute range are on their way. They’re past the early hurdles of failing to capture attention, but they still need more repeat play and stronger retention to climb into the next tier. This is the range where doubling down on systems that drive daily returns can unlock the growth path toward becoming a top game.
13-18 minute session length
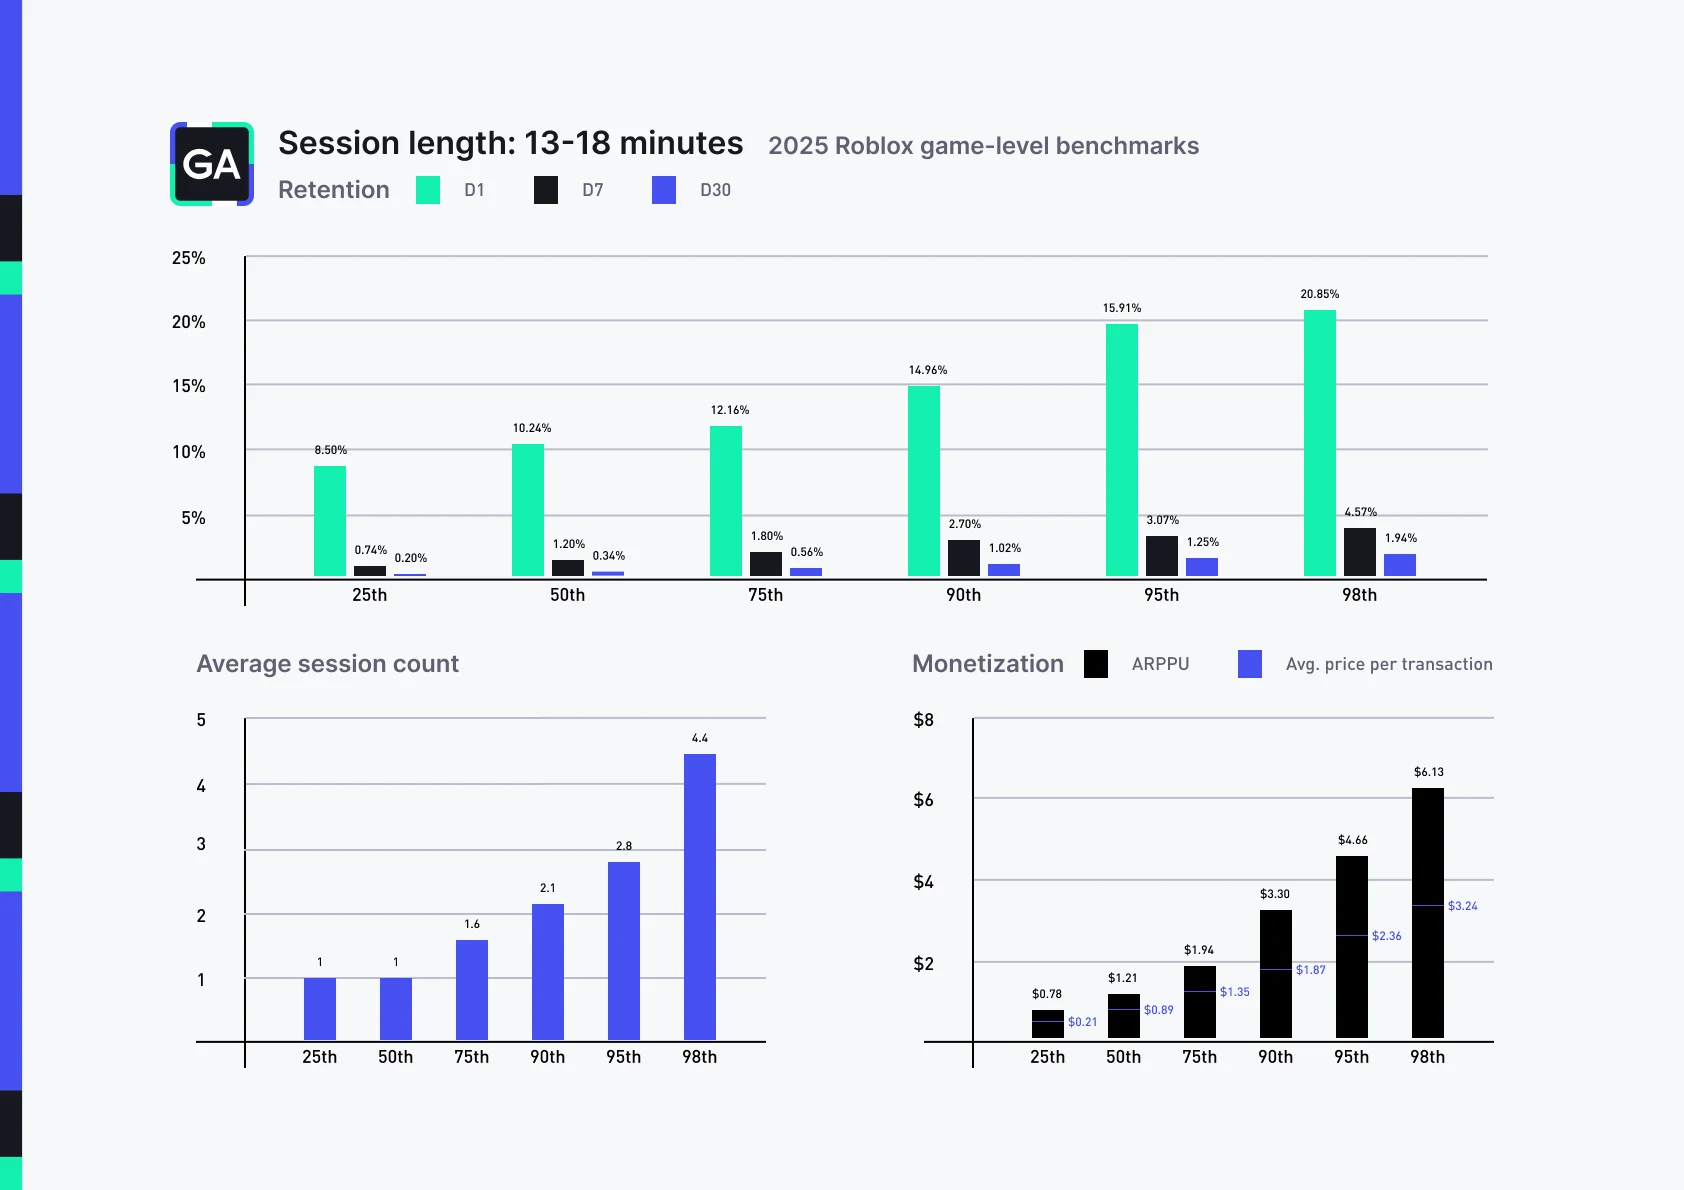
Games in the 13-18 minute range are beginning to enter “hit territory.” Players here are committing to longer sessions, which signals that these games are doing a solid job of onboarding and creating meaningful gameplay loops. While average daily session counts do not rise dramatically as most players are still logging in just once per day, the quality of those sessions is increasing. At the higher end, users in the 95th percentile are coming back nearly three times a day, and the very top of the curve (98th percentile) sees over four daily sessions. These numbers reveal that top performers in this bracket are not only retaining players for longer, but also beginning to nudge them into more frequent return play.
Retention metrics reinforce that these games are sticking. Day 1 retention jumps into double digits at the median (~10%), while the top performers are holding onto 15–20% of players. By Day 7, retention reaches 1–3% at the middle and climbs to nearly 5% at the very top. Day 30 retention, though still relatively low, edges above 1% in the upper percentiles, giving out a strong signal that players are finding reasons to return weeks later. Compared to the lower engagement brackets, this is a meaningful step up. Players are not just testing the game; they’re actually building habits around it.
Monetization also looks much healthier here. Median ARPPU more than doubles compared to the lowest brackets, sitting at just over $1.20, with the top games pushing past $6 per payer. Average transaction values scale accordingly, ranging from under $1 at the low end to more than $3 at the very top. This indicates that players who are engaged long enough to spend 13 minutes or more in a session are also more inclined to convert and to spend at higher price points.
For developers, the implications are clear:
- You’re on the right track: Reaching this bracket means your game is successfully attracting players, getting them through onboarding, and giving them reasons to stay.
- Push for return play: While session length is strong, daily session counts are still low. Building in mechanics like time-gated rewards, co-op systems, or limited seasonal events can encourage multiple logins per day.
- Refine monetization systems: With stronger retention, you can start layering in more sophisticated monetization. Experiment with higher-value developer products, bundles, or cosmetic systems that reward longer-term players.
- Double down on social hooks: Games in this tier benefit from fostering friend-to-friend play. Designing around group objectives or co-play bonuses can increase both frequency and spend.
Overall, games in the 13-18 minute range have cleared the hardest hurdle: keeping players meaningfully engaged. The next step is evolving from a good game into a breakout hit, by driving higher session frequency and building monetization systems that capture the full potential of their committed audience.
19-24 minute session length
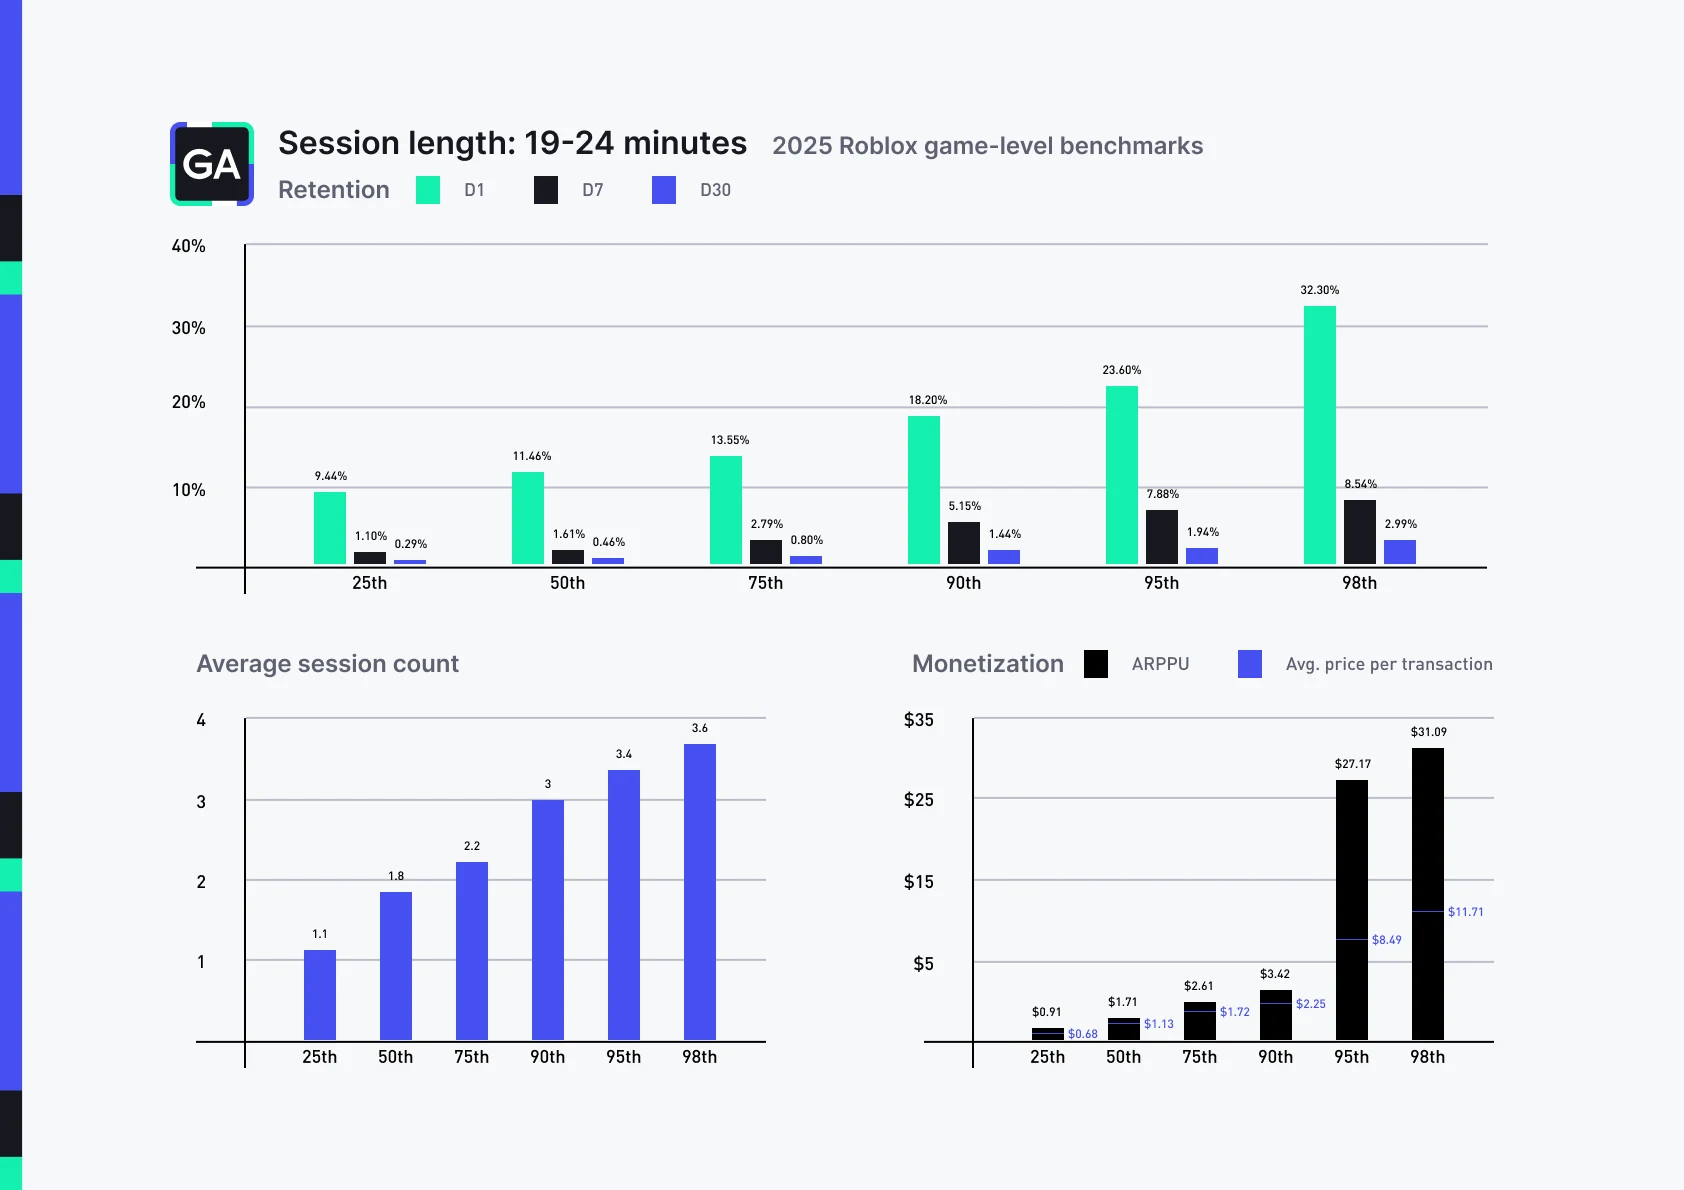
By the time a game reaches the 19-24 minute average session range, it has crossed into bona fide hit territory. The daily session counts are higher than any of the earlier ranges, with the median player logging nearly two sessions a day and the top performers at 3+ sessions. This shows that players are not just staying longer per session, they’re coming back consistently too.
Retention metrics reinforce this picture. Day 1 retention climbs into double digits across the board, with the 90th percentile nearly doubling what we saw in the 13-18 minute grouping. Long-term retention is especially striking: at the 95th percentile, nearly 8% of players are still around at Day 7, and almost 2% are still active at Day 30. These are standout numbers that separate successful games from the pack, and prove these experiences are not only onboarding players effectively but keeping them engagedover weeks.
Monetization tells an even stronger story. The average revenue per paying user makes a big leap compared to earlier groups, with the 95th and 98th percentiles shooting far ahead: ARPPU spikes into the high 20’s and low 30’s. Average transaction size follows the same pattern, suggesting that committed players are not just spending, but spending big. This is where well-crafted game passes, premium cosmetics, and high-value consumables clearly find traction.
For developers, the challenge shifts at this stage:
- Double down on live-ops: Seasonal updates, rotating events, and regular content drops are crucial to sustain momentum.
- Keep communities energized: Strong retention numbers signal that players want to stay. Give them reasons to keep coming back through social play, co-op goals, and competition.
- Expand monetization variety: Lean into high-value game passes and consumables, but ensure there are options for both light spenders and whales.
- Focus on scalability: At this level, stability, moderation, and community management become just as important as content itself.
Games in this bracket are proven hits. The task is no longer just hooking players. It’s maintaining growth, managing communities, and ensuring that engagement and monetization do not plateau.
25+ minute session length
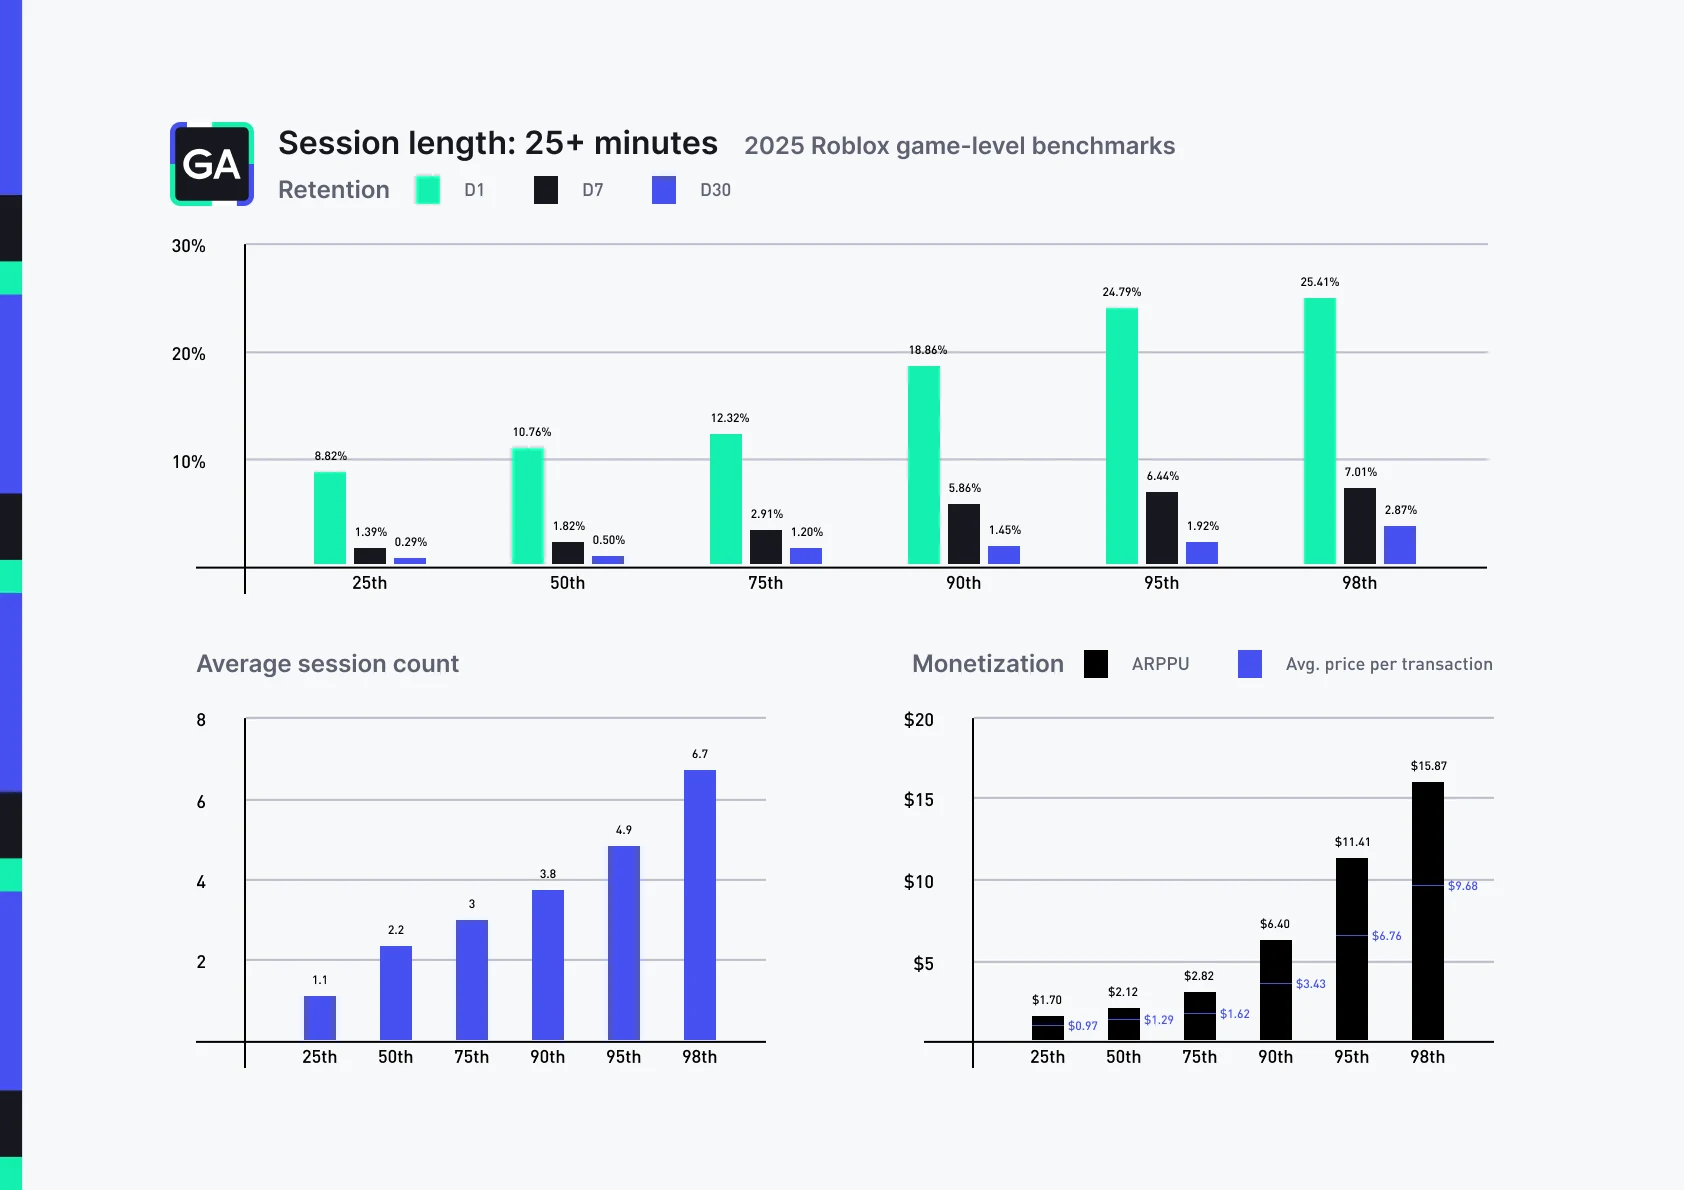
At 25+ minutes, we’re looking at Roblox’s deepest engagement tier - the games that hold players the longest and pull them back the most often. Daily session counts spike significantly in this group: the median player logs over two sessions per day, while the 95th percentile is nearly five, and the very top (98th percentile) is close to seven. This data illustrates that not only are these games sticky in terms of single-session duration, but they are also driving repeat engagement within the same day at higher levels than any other tier.
Retention follows a similar high ceiling as the 19-24 minute group. Day 1 retention is well into double digits across the board, with top-performing games holding nearly one in four players past that first day. D7 and D30 numbers also push the upper bounds of what Roblox games can realistically achieve, strong signals that these experiences have found their audience and are sustaining them over time. That said, there is not much more room to grow here; this tier is essentially the plateau for retention performance.
Monetization tells a more complex story. While ARPPU levels are high (with the best games driving $10+ per payer), the numbers are not uniformly stronger than the previous tier. In some cases, they even come in lower. The average transaction size shows similar variability: some games are converting big-ticket purchases ($6–$9+), but the spread is wide, suggesting not every long-session game is automatically monetization-optimized. Just because players spend 25+ minutes in your game does not guarantee they’ll spend big - design still matters.
For developers at this level, the challenge is not hitting baseline metrics, it’s refining systems to keep pace with high expectations:
- Lean into session depth: Players are already staying a long time. You should make sure late-session loops stay rewarding and avoid fatigue.
- Protect and evolve your repeat session loop: Games in this tier already excel at re-engagement, so the focus shifts to keeping those loops fresh and monetization-rich without burning out the audience.
- Tighten monetization design: Big session times do not guarantee spending. Ensure your progression, bundles, and cosmetics align with the value players are already demonstrating.
- Sustain through live-ops: Regular content, events, and meta-layer updates are the only way to hold these high engagement levels over months.
Games in the 25+ minute bucket are at the top of the mountain: they’ve cracked the code on both onboarding and retention. But the margin for error is small. Developers here must continue tuning content and monetization carefully to avoid players slipping down into shorter engagement ranges. Or worse, churning out altogether.
Conclusion
Roblox has reached a scale where success is no longer about luck - it’s about climbing a measurable ladder. This report shows how games progress from fragile early releases with short sessions and low retention, to fully mature hits sustaining millions of players and driving meaningful revenue. Each rung on the ladder comes with its own challenges: first proving your hook, then establishing repeat play, then scaling retention and monetization without burning players out.
For developers, the path forward is clear. Use the benchmarks in this report to locate where your game sits today, then focus on the right problems for that stage. Trying to scale monetization before you’ve solved retention, or chasing retention before players even understand your hook, is a recipe for wasted effort. The most successful studios align their priorities with their position on the ladder.
To make this concrete, the data points to a simple playbook:
The Roblox growth checklist
- Win the first two minutes: Ensure clarity, fast onboarding, and an immediate sense of reward.
- Build reasons to return: Use quests, streaks, offline progression, and co-play systems that draw players back daily.
- Layer depth for Core Users: Progression, cosmetics, and social loops keep your most engaged players grinding for 20+ minutes.
- Tie monetization into engagement loops: Design spend that reinforces reasons to log back in, not just one-off purchases.
- Optimize for recurring spend: Focus on bundles, battle passes, and renewable offers that encourage weekly or daily repeat purchases.
Roblox’s ecosystem is competitive, but also full of opportunity. By understanding where you stand against benchmarks and applying this checklist step by step, you can move your game from a prototype to a habit - and from a habit to a hit.