
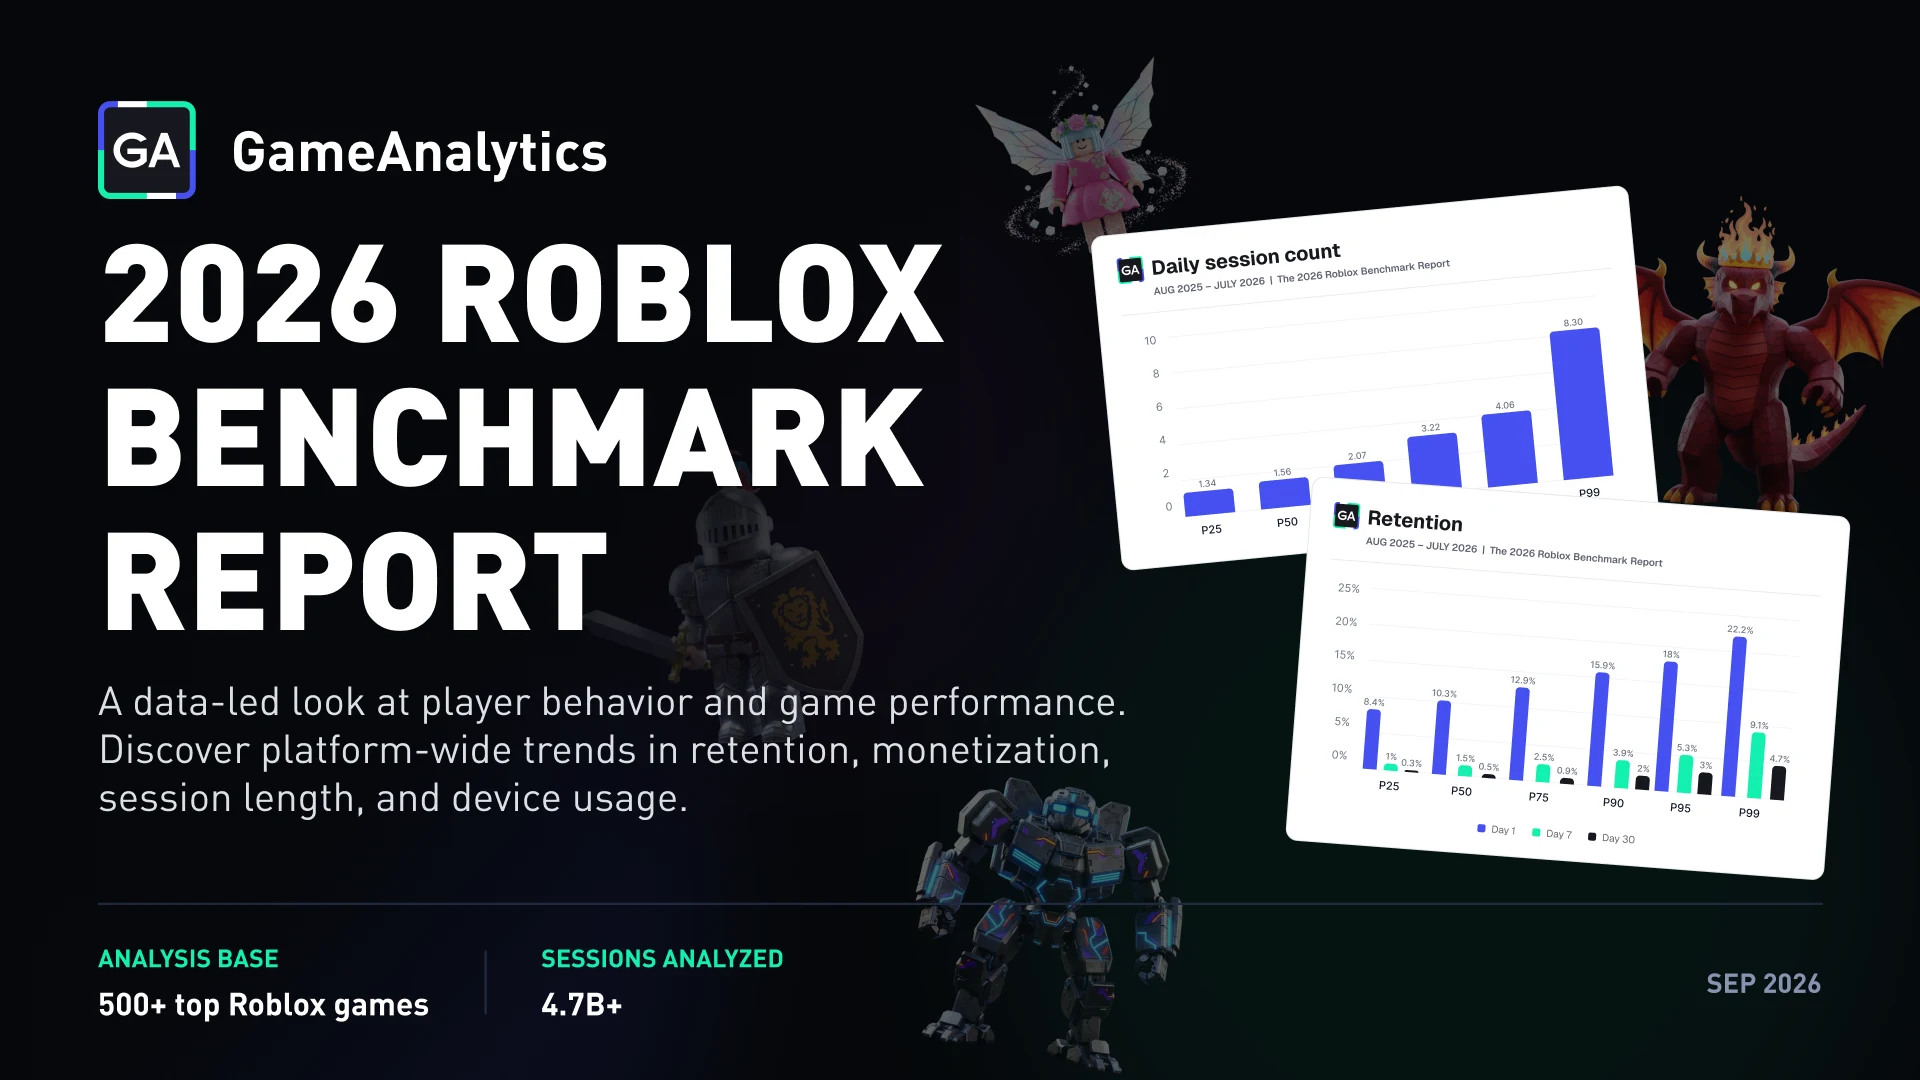
A data-led look at player behavior and game performance.
TL;DR
The 2026 Roblox Benchmark Report looks at player behavior and game performance across 500+ Roblox titles with 1M+ monthly active users (Aug 2025-July 2026). Key findings:
- Devices: 44% of players use both mobile and PC, players are shifting slightly toward single-device use.
- Player behavior: the median player opens Roblox 3 times a day; total daily time and money is spread thin across many games, not concentrated in any one.
- Game benchmarks: even large, established games see only 10.3% D1 retention and modest per-payer revenue at the median. A small number of top performers pull dramatically ahead on monetization.
- What's new: Roblox's August 2026 discovery update now rewards games strong in both retention and monetization together, not either alone.
The takeaway: attention and spend on Roblox are finite and unevenly distributed. Growth comes from capturing a larger share of what already exists, not assuming more is available.
The GameAnalytics Roblox report provides valuable benchmark data, which you can't find anywhere else. I especially appreciate the game retention benchmarks, which are particularly useful given Roblox's recent algorithm changes prioritizing retention.

Introduction
Roblox in 2026 is bigger, more competitive, and more precise about what it rewards than it was even a year ago. This report draws on gameplay data from hundreds of Roblox titles spanning August 2025 through July 2026, to give you a grounded picture of what player behavior and game performance actually look like at scale.
It's split into two parts. The first looks at players themselves: where they show up, how often, and how much of their time and money is realistically available to any single game. The second looks at individual games: session length, session count, retention, and revenue, benchmarked against hundreds of other large, established titles.
Throughout, we've tried to be as transparent as the data allows, including where our numbers diverge from Roblox's own reporting or from benchmarks circulating elsewhere, and why. The goal isn't to tell you your experience is doing better or worse than you think. It's to give you an honest, well-sourced reference point for figuring that out yourself.
Attention and spend on Roblox are finite, and they are not distributed evenly. A small number of players account for a disproportionate share of activity and revenue, and a small number of games capture far more of both than the typical title does.
Key takeaways
Roblox in 2026 rewards two things at once, and increasingly, together: keeping players around, and giving them a reason to spend once they do. This report's benchmarks are drawn from over 500 titles with at least 1 million monthly active users, so even the "median" figures throughout represent large, established games, not typical new releases. Read every number here with that in mind: if your game is smaller, doing better than the low end of these benchmarks is a genuinely strong signal, not a low bar.
Roblox player behavior trends
- Players are still fluid across devices, but slightly less than before. 44.00% of players use both mobile and PC, down from 48.39% in 2025. PC-only (40.76%) and mobile-only (11.55%) both grew. Build for both platforms as a baseline, but don't assume every player is switching mid-session.
- Frequency and length tell different stories. The median player opens Roblox 3 times a day, but a session can run anywhere from a few minutes to well over an hour depending on the percentile. The top 1% of players, by either measure, are a different category of user, not a stretch goal for the average one.
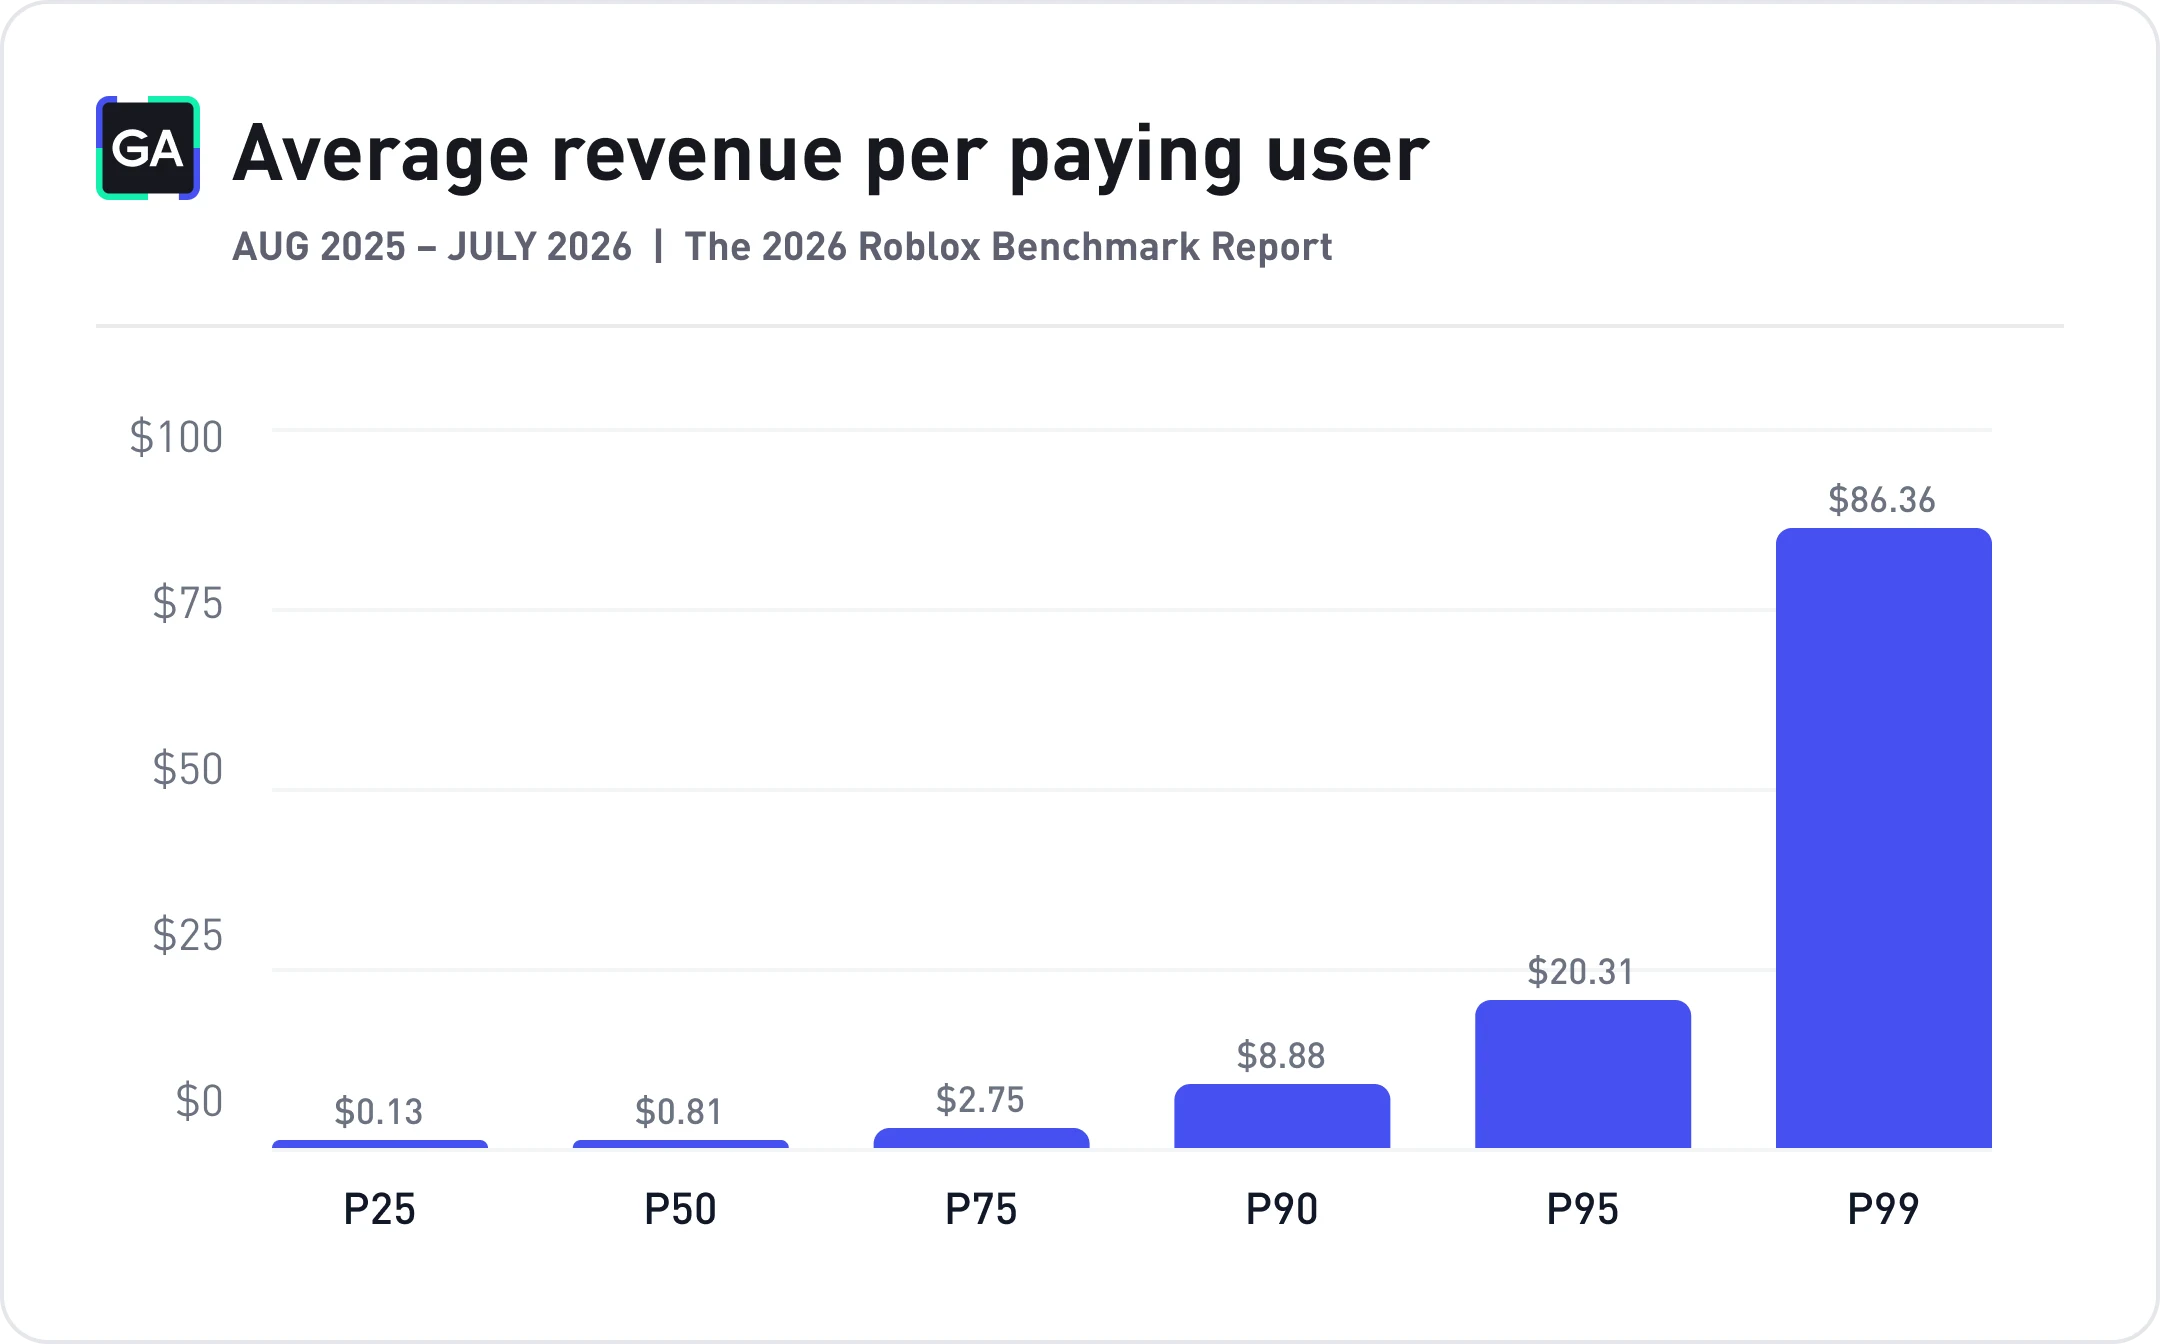
- Spending is heavily concentrated at the top. The top 1% of paying players spend $86.36, more than four times the 95th percentile figure. Most of a game's monetization opportunity from any single player will be modest; a small number of already-heavy spenders account for a disproportionate share of the rest.
Roblox game-level benchmarks
- Even among large games, most players don't come back. Median D1 retention is 10.3%, D7 is 1.6%, and D30 is 0.5%. This is normal for the platform, not a sign of a failing game.
- Frequency and length tell different stories. The median player opens Roblox 3 times a day, but a session can run anywhere from a few minutes to well over an hour depending on the percentile. The top 1% of players, by either measure, are a different category of user, not a stretch goal for the average one.
- Spending is heavily concentrated at the top. The top 1% of paying players spend $86.36, more than four times the 95th percentile figure. Most of a game's monetization opportunity from any single player will be modest; a small number of already-heavy spenders account for a disproportionate share of the rest.
Methodology & Scope
This report draws on gameplay data from over 500 Roblox titles that reached at least 1 million monthly active users between August 1, 2025 and July 31, 2026. Within this sample, 67 titles exceeded 10 million monthly sessions, and 253 exceeded 1 million, together accounting for 4.76 billion sessions over the period. Unless otherwise noted, every metric in this report, across both player behavior and game benchmarks, is drawn from this sample.
We set the bar at 1 million MAU deliberately. This is not a snapshot of every game on Roblox, it's a benchmark of the games that are already working. A 1M+ threshold filters out the noise of early-stage and abandoned titles and leaves a sample of games with real, sustained traffic, which is exactly what makes the numbers in this report actionable. If your game outperforms the median here, you're outperforming games that have already proven themselves at scale, not just clearing a low bar.
This is also a meaningful year to be measuring established games specifically. Roblox's own disclosures show daily active users falling every quarter since Q3 2025, from 152 million down to 123 million by Q2 2026 (Roblox Q2 2026 shareholder letter), alongside a sharp slowdown in bookings growth that the company has attributed to a shift away from high-monetizing hits and toward changes in its discovery algorithm that favor long-term retention over near-term spend (Roblox Q2 2026 earnings coverage, Yahoo Finance). Against that backdrop, a sample built around large, currently successful titles gives a clearer read on what's actually still working than a broader, noisier sample would. Where our own data intersects with this shift, in retention, in monetization concentration, in the discovery changes covered later in this report, we've called it out directly.
Sample composition shifts year to year as individual titles grow or decline and this year's sample may not include every title that appeared in previous editions of this report. That's an accurate reflection of a platform that is itself changing quickly.
This report is presented in two parts, and the two use different units of analysis.
Roblox player behavior examines how individual players engage with Roblox as a whole, aggregated across all GameAnalytics-tracked games a player played during the period. These figures capture only in-game activity, not non-gameplay platform activity such as chat, avatar customization, or browsing.
Roblox games benchmarks look at the performance of individual games rather than individual players. Each metric, session length, session count, retention, and revenue, is calculated and ranked independently across the games in the sample. A game's percentile rank on one metric does not imply anything about where it ranks on another; these are separate distributions, not a single combined score.
One exception: devices players use. This metric reflects coverage, which devices players access Roblox on, rather than an engagement or spending behavior, so it draws on GameAnalytics' full pool of over 17,000 integrated Roblox games rather than the 1 million MAU sample used elsewhere in this report. It is the only metric in this report calculated on that broader base.
This report reflects the games integrated with GameAnalytics. It is not a census of Roblox, it's a representative look at how the platform's proven, high-traffic games are actually performing, in a year where that distinction matters more than usual.
Roblox player behavior
Before looking at how individual games perform, it helps to understand the players themselves, where they show up, how often, and how much of their time and money is actually up for grabs. This section looks at Roblox players as a whole, aggregated across every game they play, not any single title. Think of it as the total pool of attention and spend on the platform. What follows in the next section is how much of that pool individual games actually capture.
Devices players use
Roblox players continue to move fluidly across devices, and this year holds close to the pattern we have tracked since 2023. The largest single group, at 44%, plays across both mobile and PC. PC-only players are the second-largest group at 40.76%, followed by mobile-only players at 11.55%. Console, in any combination, accounts for well under 4% of the player base.
What has shifted since the 2025 report is worth noting. PC+mobile, the combined-usage group, dropped from 48.39% in 2025 to 44% this year. At the same time, PC-only (37.56% to 40.76%) and mobile-only (previously in the 7-10% range, now 11.55%) both ticked up. Read together, this looks like a small shift away from device switching and toward players settling into one primary device. It is a modest shift, not a reversal, but it is the first year single-device usage has grown at the expense of the cross-device group.
Console remains a rounding error for most developers. Console-only usage actually fell to 0.43%, down from roughly 2% in 2025, but total console exposure, including console paired with PC or mobile, holds at 3.69%, in line with what Roblox itself reports. Console players appear to be pairing their console with another device rather than dropping off the platform.
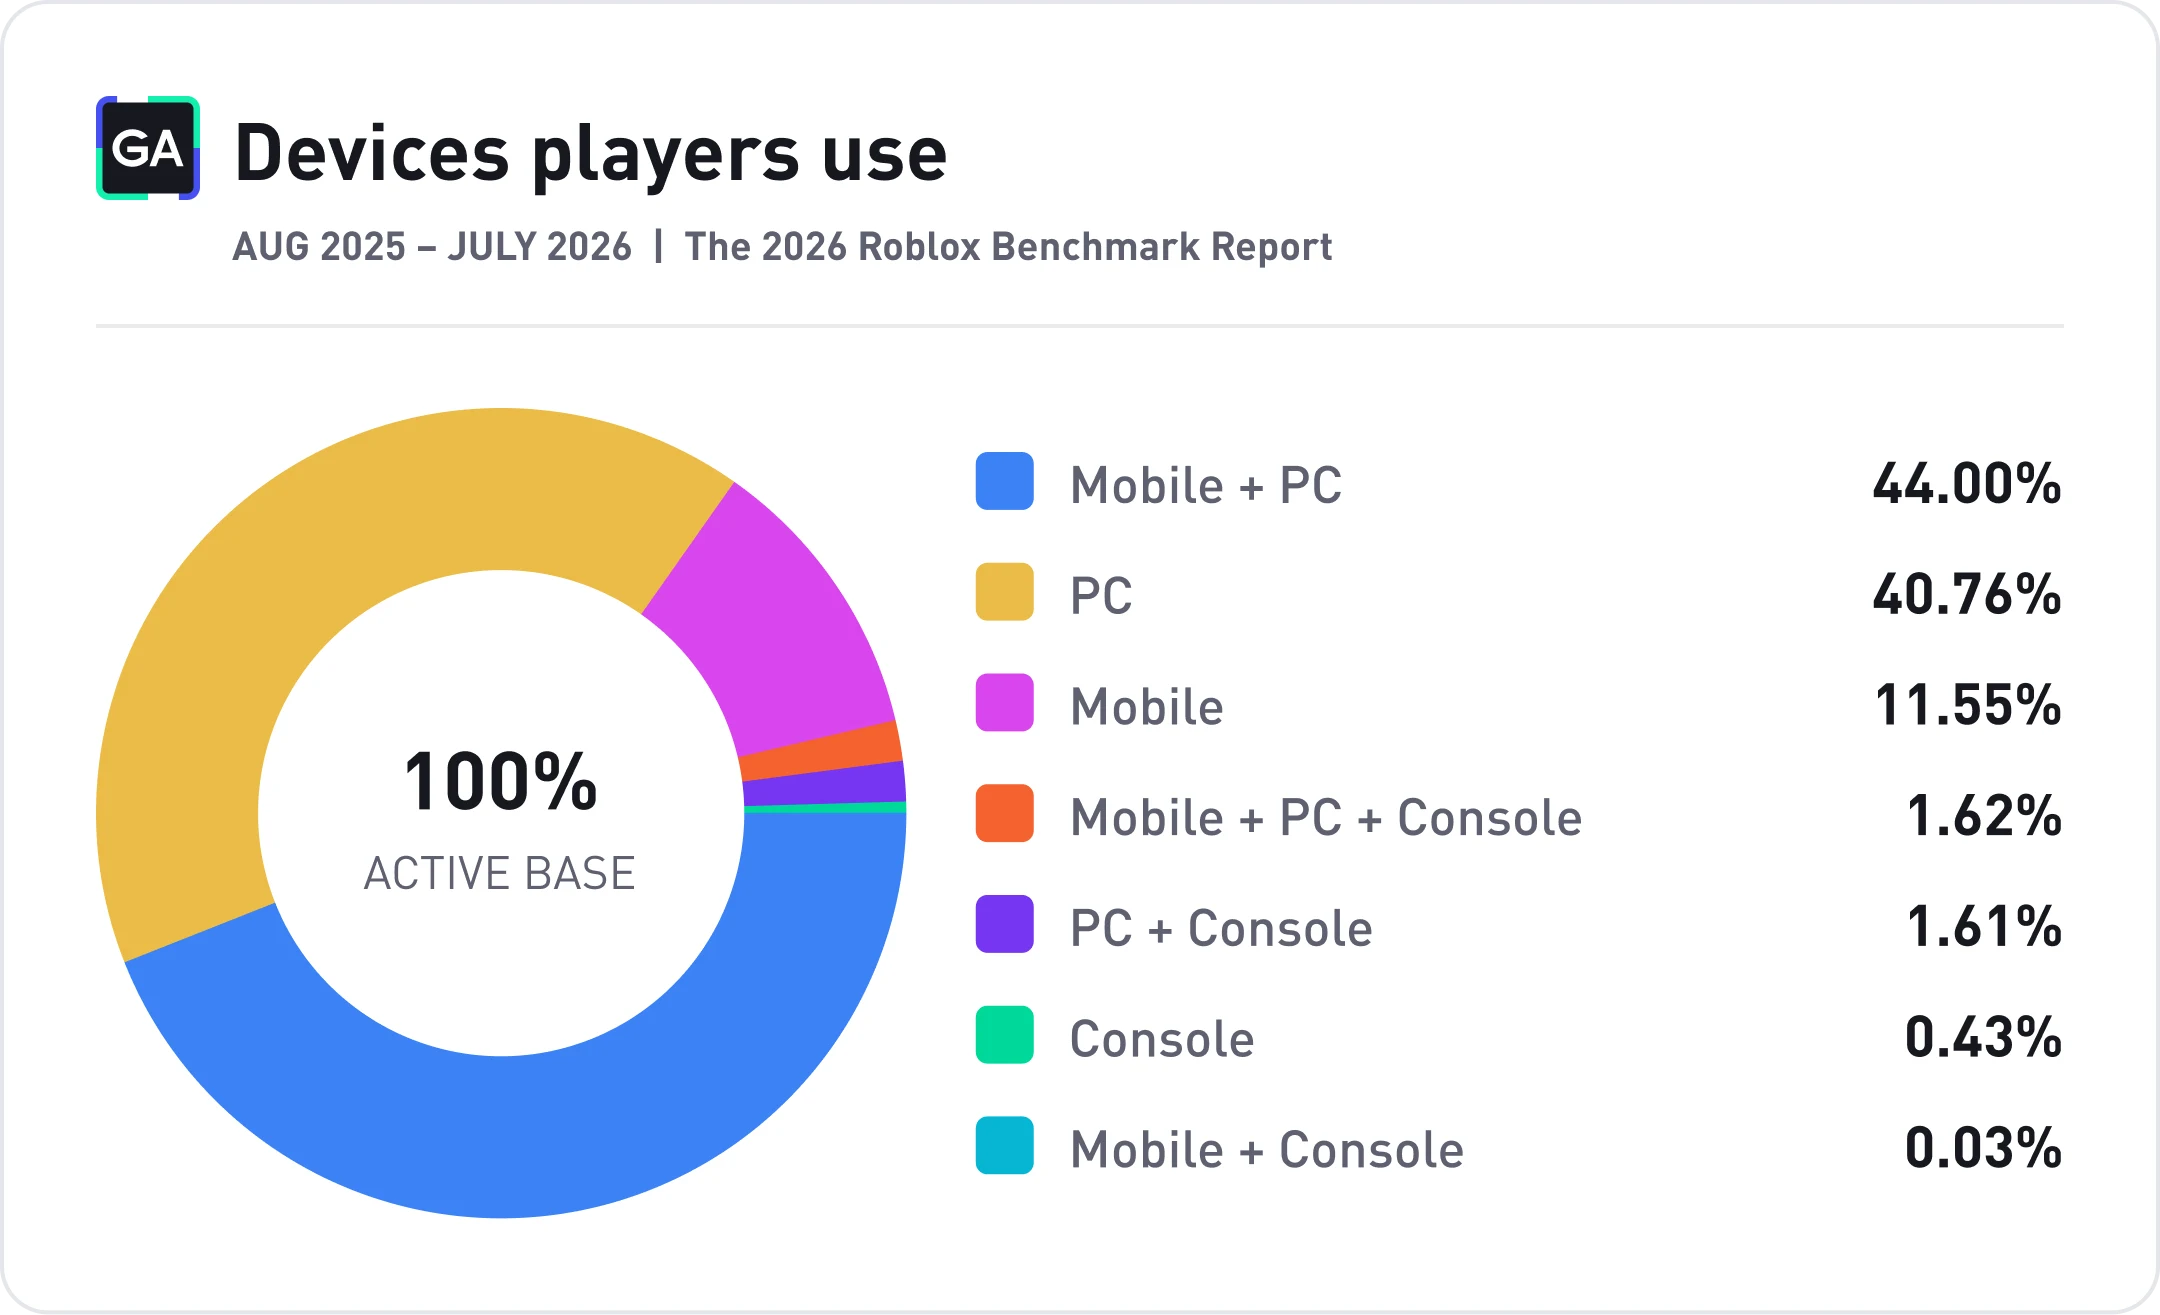
Note on calculation: This is the one metric in this report drawn from GameAnalytics' full pool of 17,000+ integrated Roblox games, rather than the 1M+ MAU sample used elsewhere. See methodology for more.
Developing a game for multiple devices is key on Roblox, as you do not want to unnecessarily limit your potential audience. However, it is important to remember that your game’s performance and user experience can vary significantly across different devices. These differences in hardware and input methods should therefore be taken into account throughout the design, development, and testing processes.


Average daily session frequency per user
Most players return only a handful of times a day across the Roblox experiences they play. The median player logs 3 sessions daily, across whatever GameAnalytics-tracked games they used that day. At the 75th percentile, that reaches 6, and by the 90th percentile, it climbs to 11. The 95th percentile sits at 17 sessions a day, and the very top of the distribution, the 99th percentile, reaches 42.
That gap between p95 and p99 is worth sitting with. A jump from 17 to 42 is not a smooth continuation of the same curve but a different kind of play pattern, likely driven by short check-in loops rather than casual return visits. Games with idle or offline progression, such as a potion finishing, a crop ready to harvest, or a timer resolving, are built to pull players back this often. High session counts at this end of the distribution are more likely a sign of retention mechanics doing their job than of passive, low-intent usage.
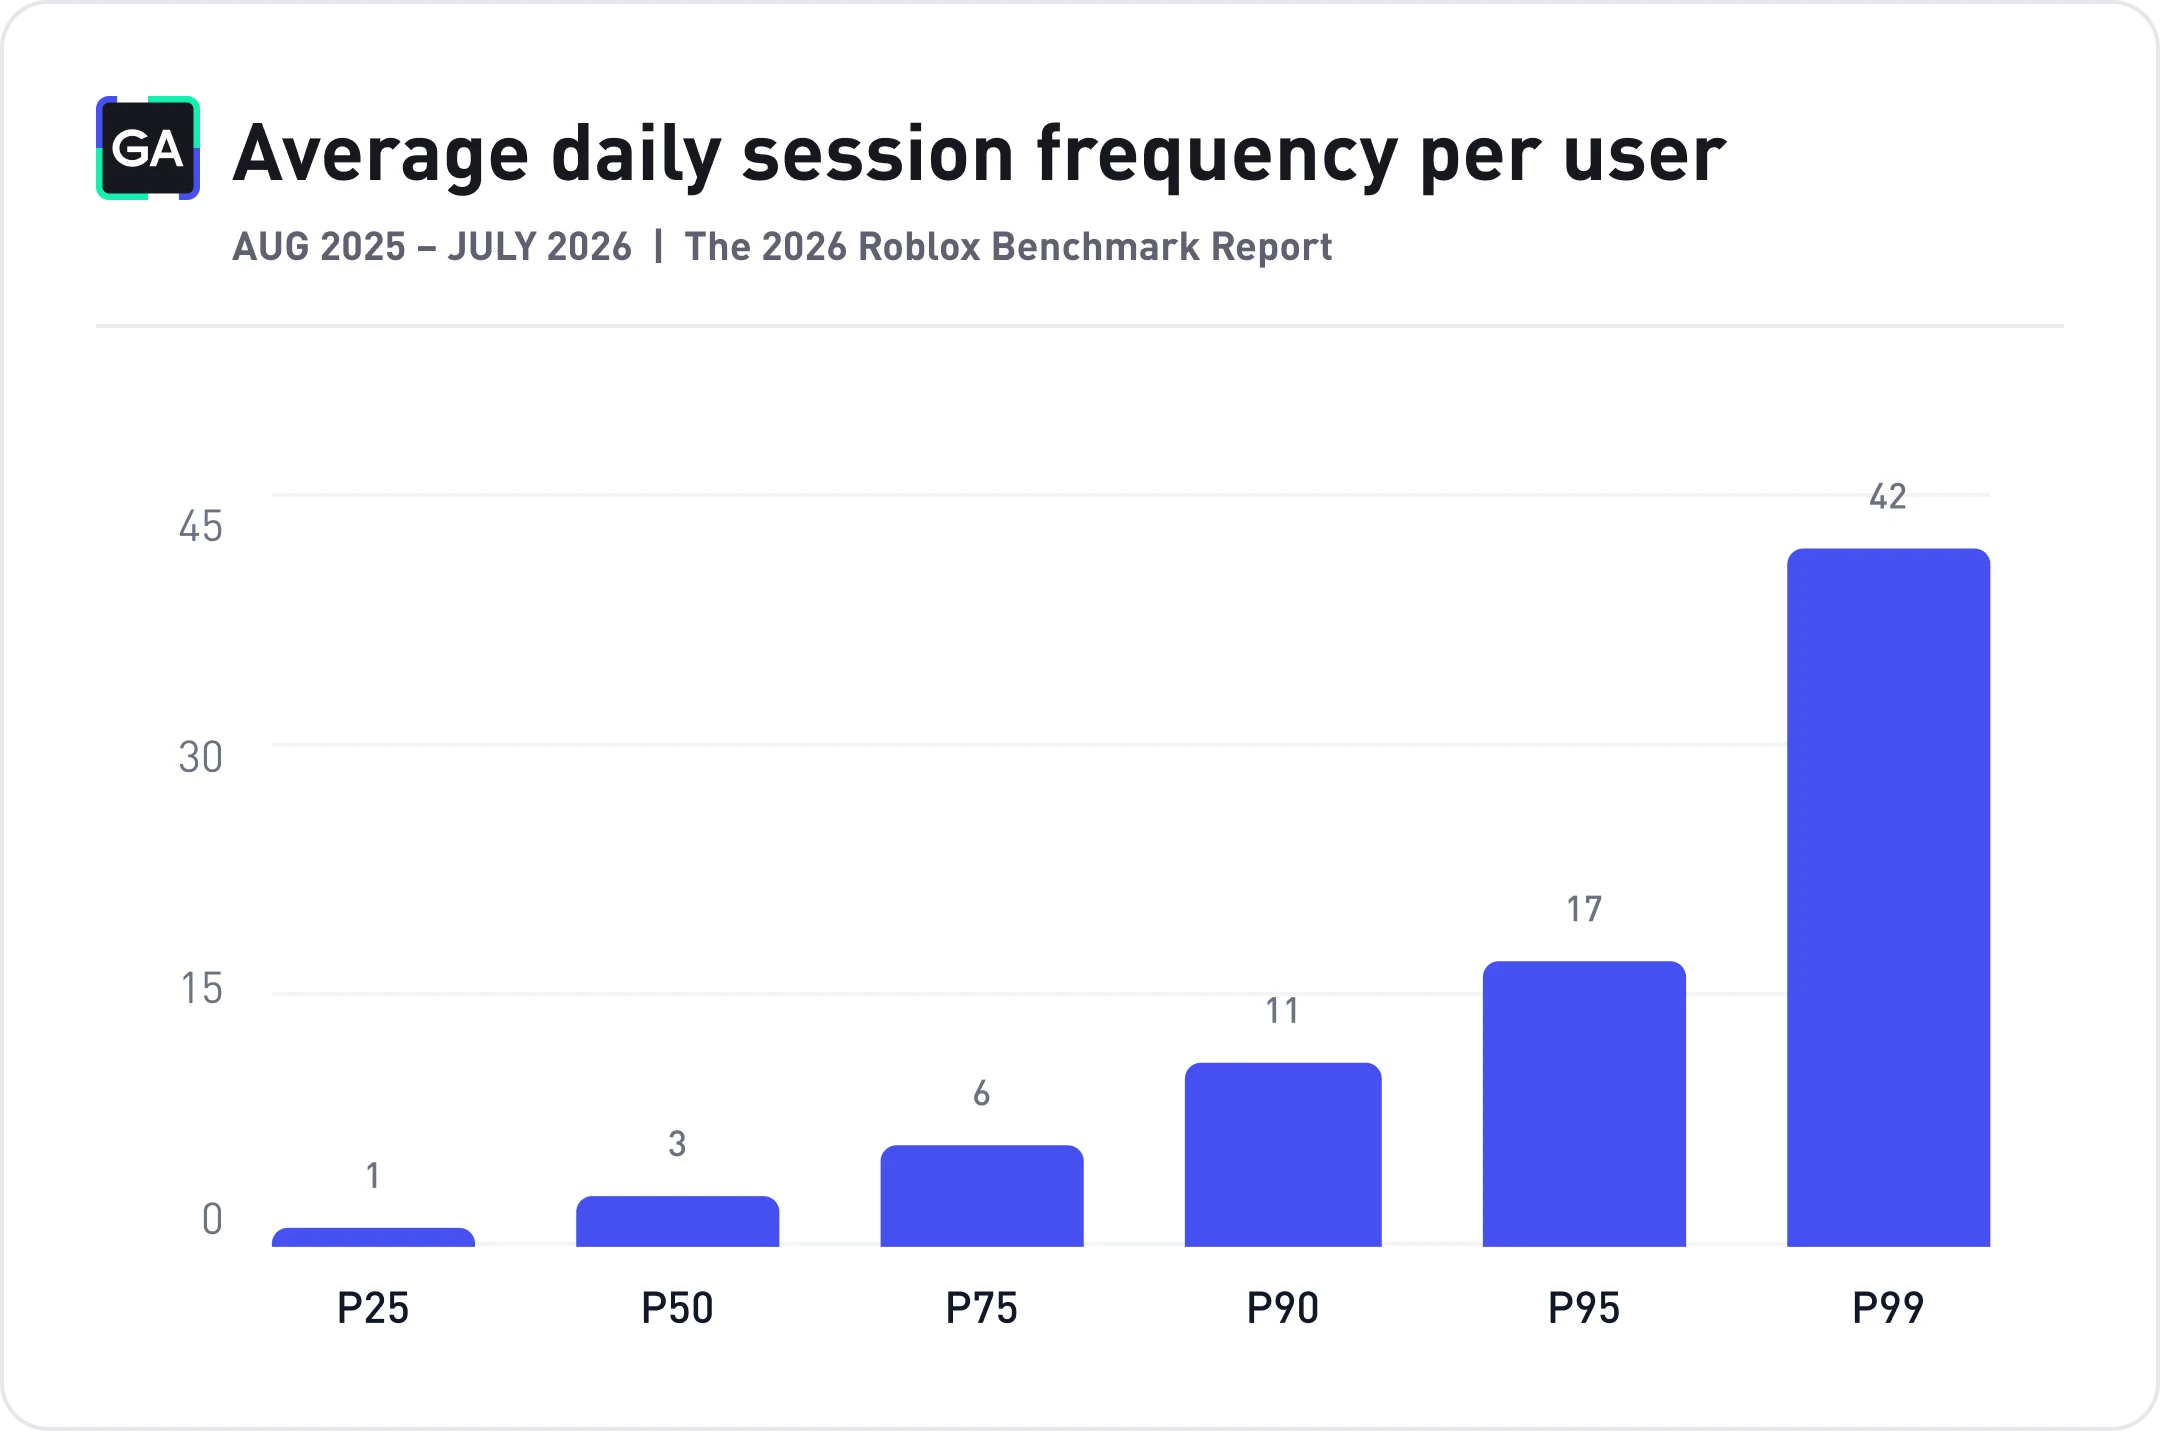
Note on calculation: These are player-level totals across all the games we track for that player, not sessions in any one title specifically. A player logging 6 sessions a day may be splitting that across several experiences, yours included.
Average daily session length per user
Session length tells a different story from frequency, and it is worth reading as its own metric rather than as a companion piece. The median session runs 7.28 minutes. At the 75th percentile that grows to 14.85 minutes, roughly double. The 90th percentile reaches 26.30 minutes, the 95th climbs to 37.18, and the top 1% of sessions stretch to 74.82 minutes.
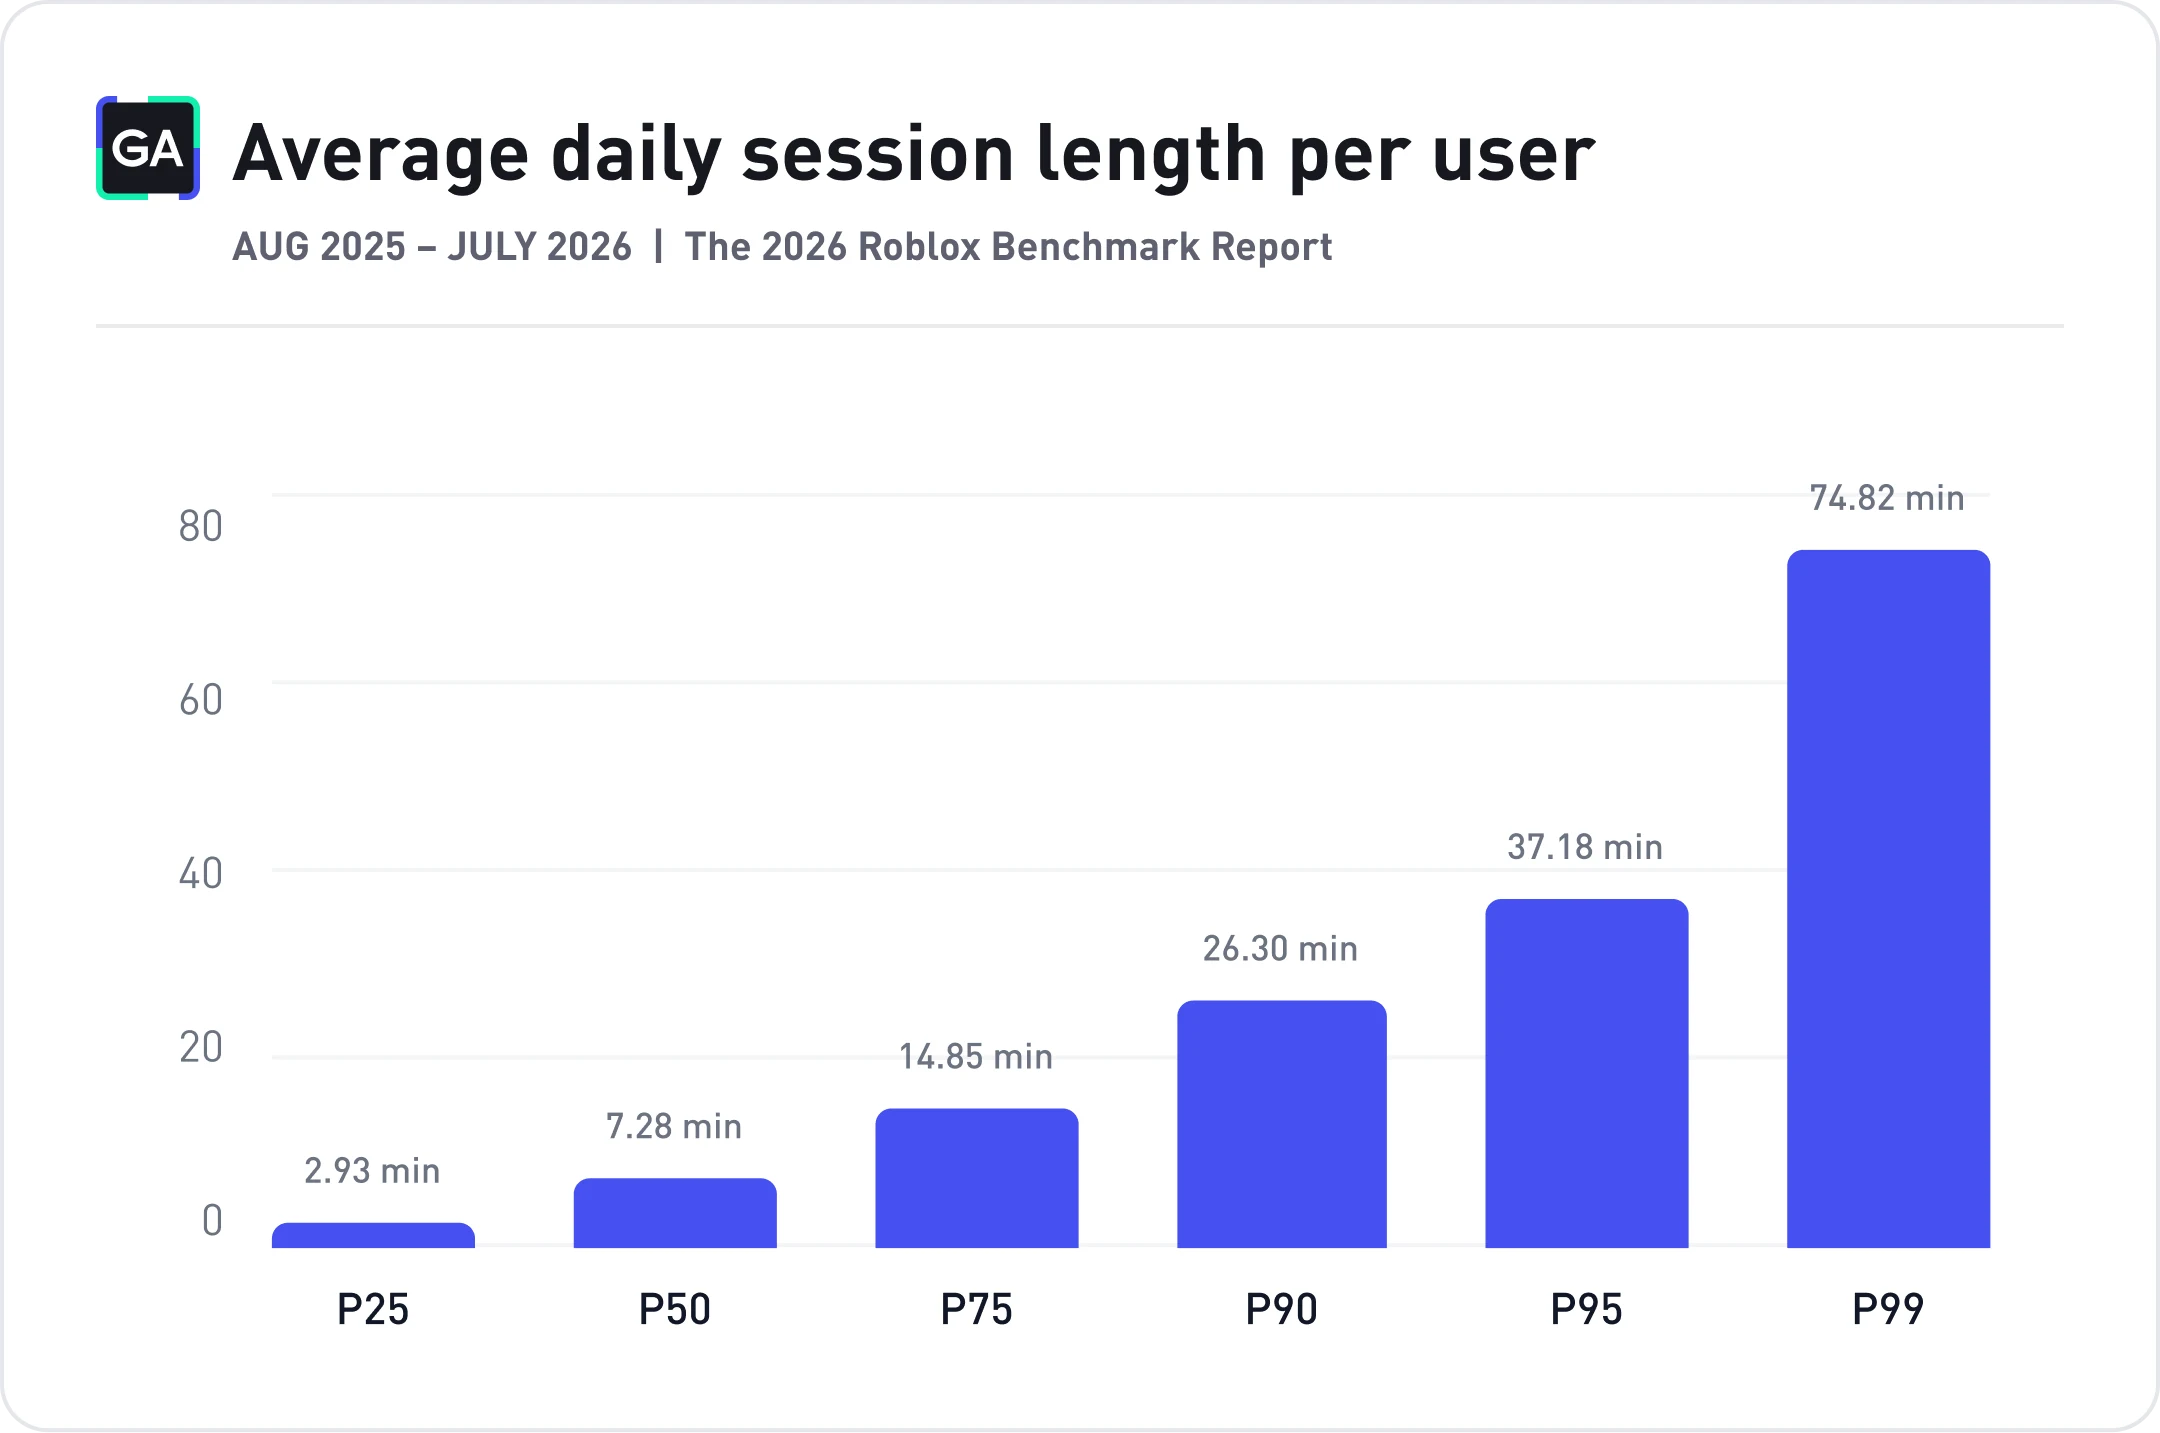
Note on calculation: This figure reflects average session length across the Roblox experiences a player used in one session. Some third-party estimates put Roblox's platform-wide average session around 27 minutes, while individual creators on Roblox's own developer forum often report per-experience averages in the 10-14 minute range from their own creator dashboards.
These are reference points from other sources, not benchmarks for the same metric: ours is pooled at the player level across whatever titles they played, while those reflect either a single game's dashboard or platform-wide totals including non-gameplay activity.
Average total daily playtime per user
Total daily playtime captures everything a player does across every session in a single day. The median player spends 22.4 minutes a day. That climbs to 58.70 minutes at the 75th percentile, 123.85 minutes (a little over two hours) at the 90th, and 186.47 minutes at the 95th. At the top of the distribution, the 99th percentile, players spend 404.98 minutes, nearly seven hours, across their Roblox activity in one day.
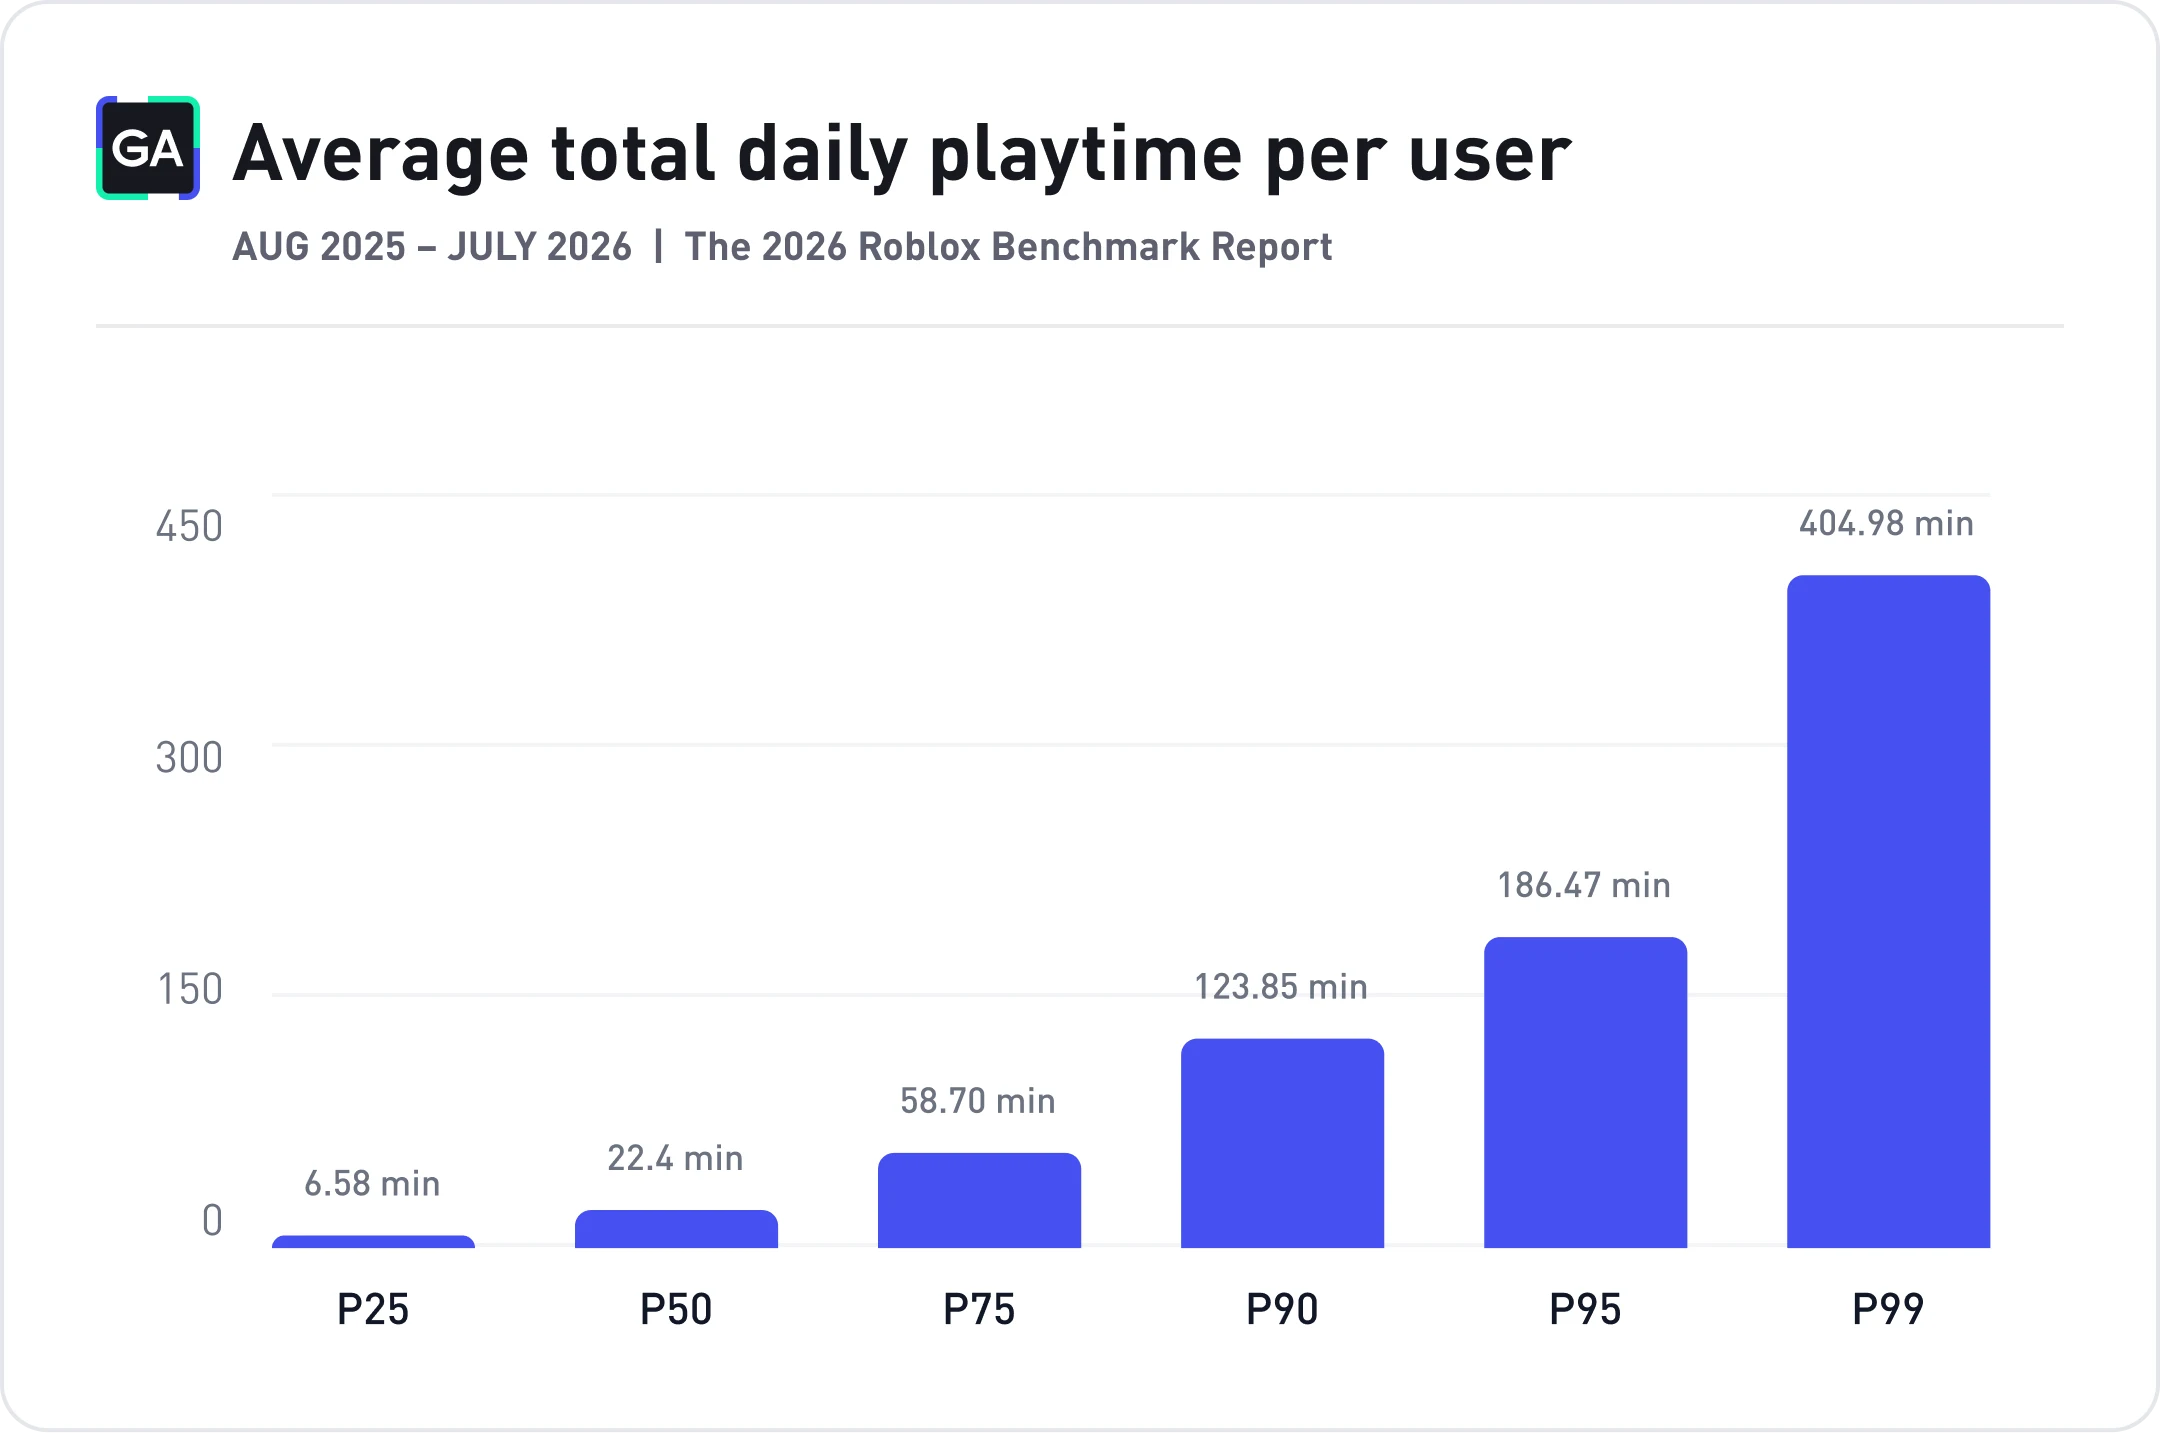
Note on calculation: Roblox has publicly reported that the average user spends about 2.7 hours (162 minutes) a day on the platform overall. Roblox's figure spans every experience plus non-gameplay activity like chat and avatar customization. Ours reflects only the games that integrate GameAnalytics. The two numbers measure different things, not the same thing at different scales.
Average revenue per paying user
Among players who spend anything at all, most spend very little. The median paying player puts down $0.81 across the period. That climbs to $2.75 at the 75th percentile and $8.88 at the 90th. By the 95th percentile, spend reaches $20.31.
Alongside spend itself, 3.80% of tracked players paid anything at all across the period.
Roblox game-level benchmarks
With the player-level picture in view, this section turns to individual games. Every metric here, session length, session count, retention, and revenue, is calculated at the game level and ranked against the 500+ titles in this year's sample, all with at least 1 million monthly active users. This is where you can see how a specific game's performance compares to others operating at real scale, not how players behave across the platform as a whole.
Average daily session length per game
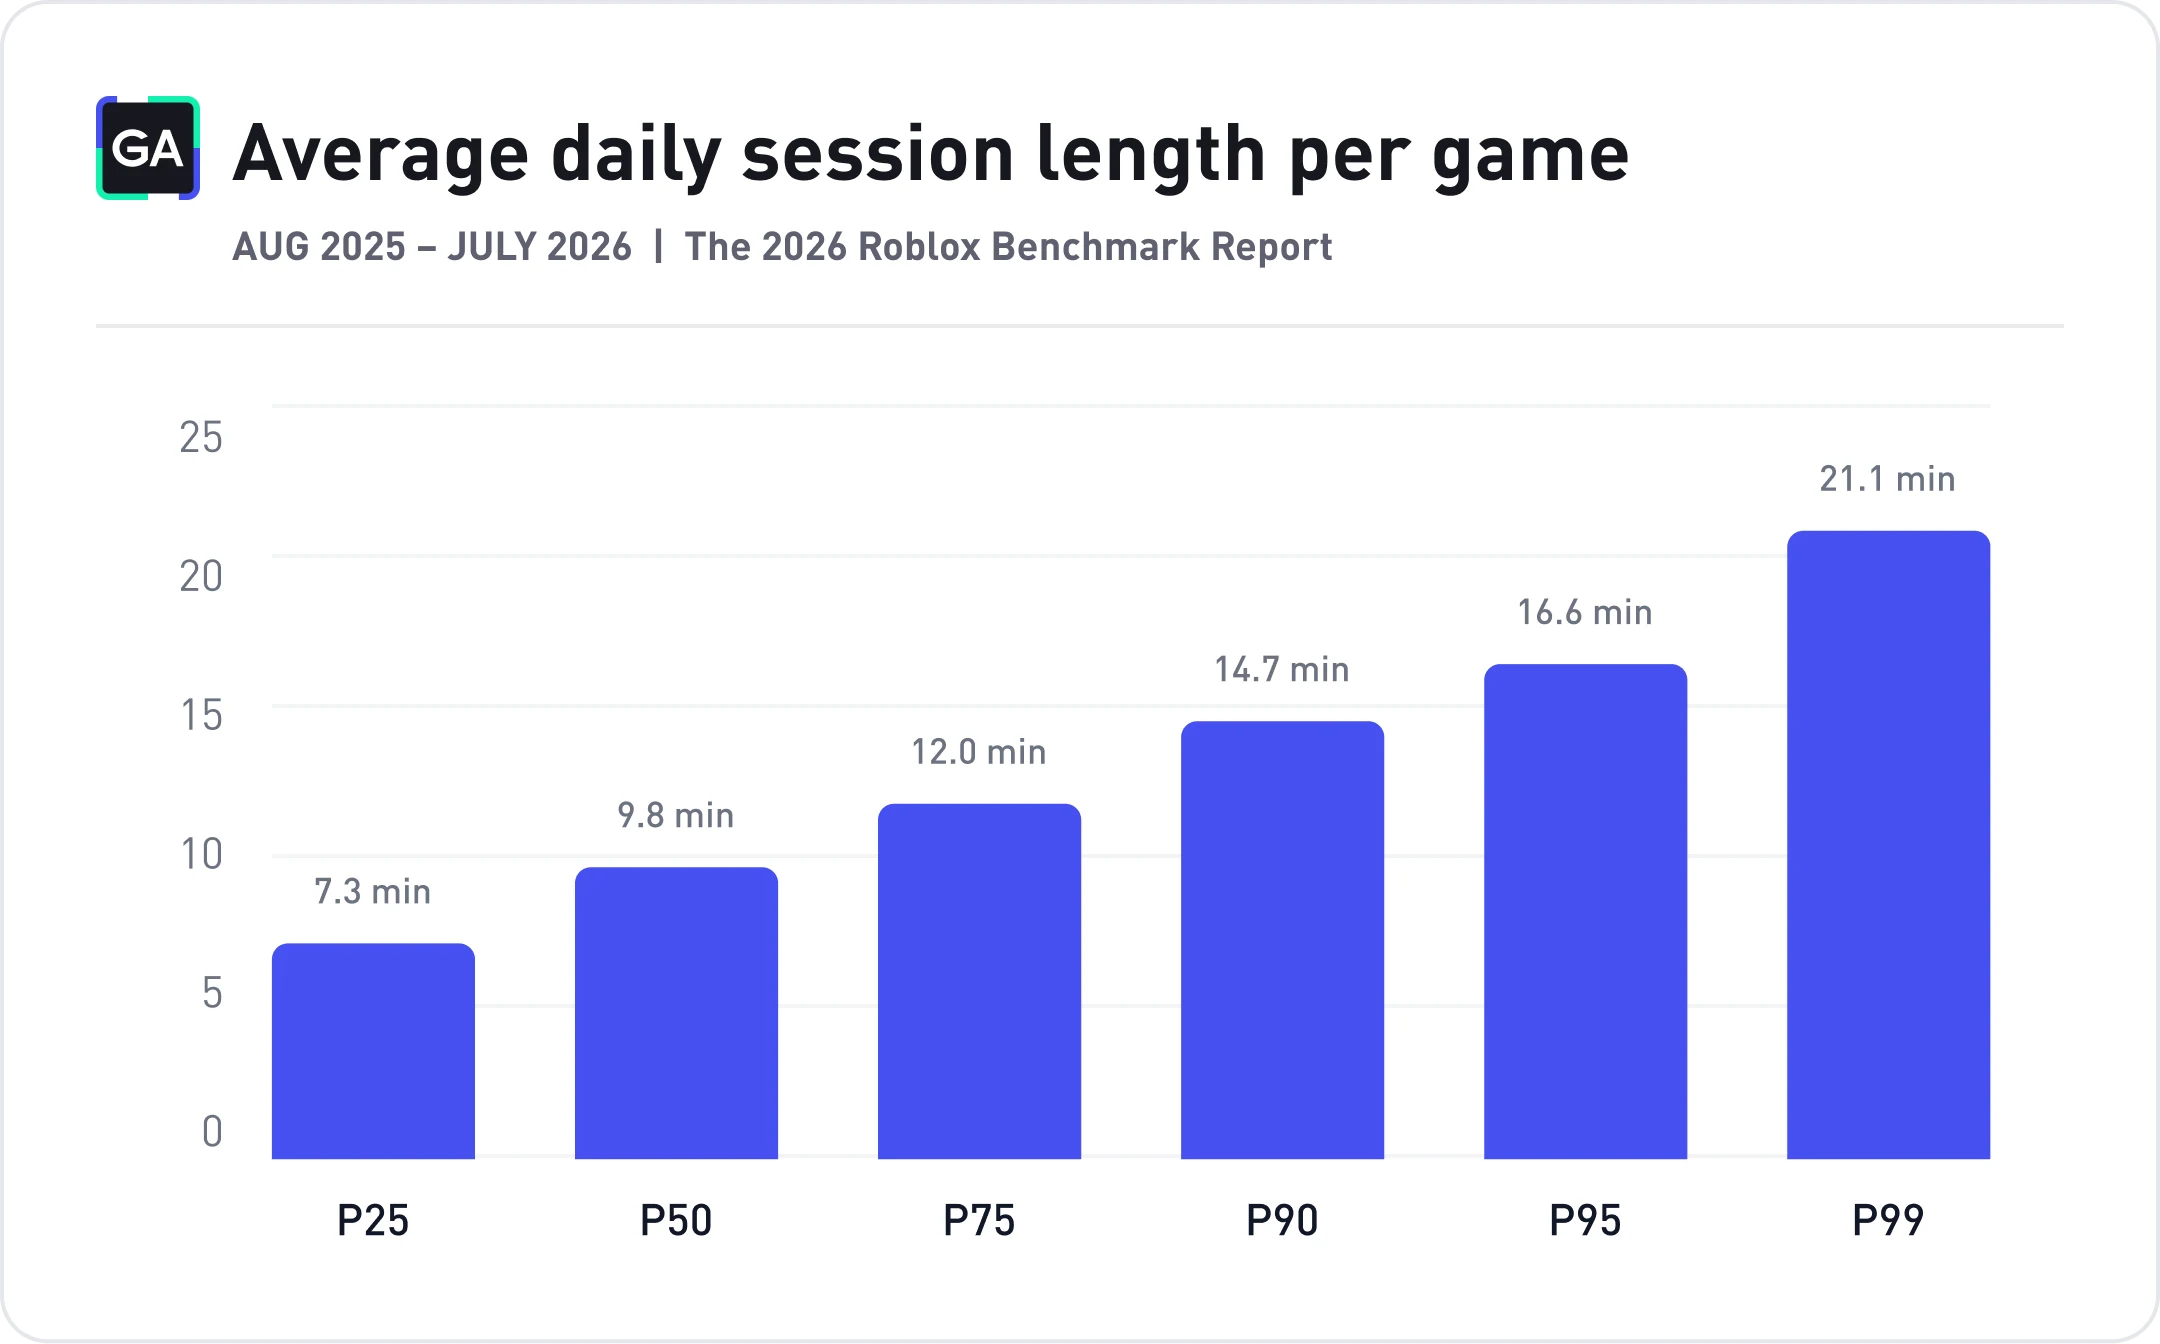
This is where session length becomes something a specific game controls, rather than a player's pooled activity across the platform. The median game holds players for 9.8 minutes per session. At the 75th percentile that reaches 12.0 minutes, and by the 90th percentile it climbs to 14.7. The 95th percentile sits at 16.6 minutes, and the top 1% of games reach 21.1 minutes.
Average daily session count per game
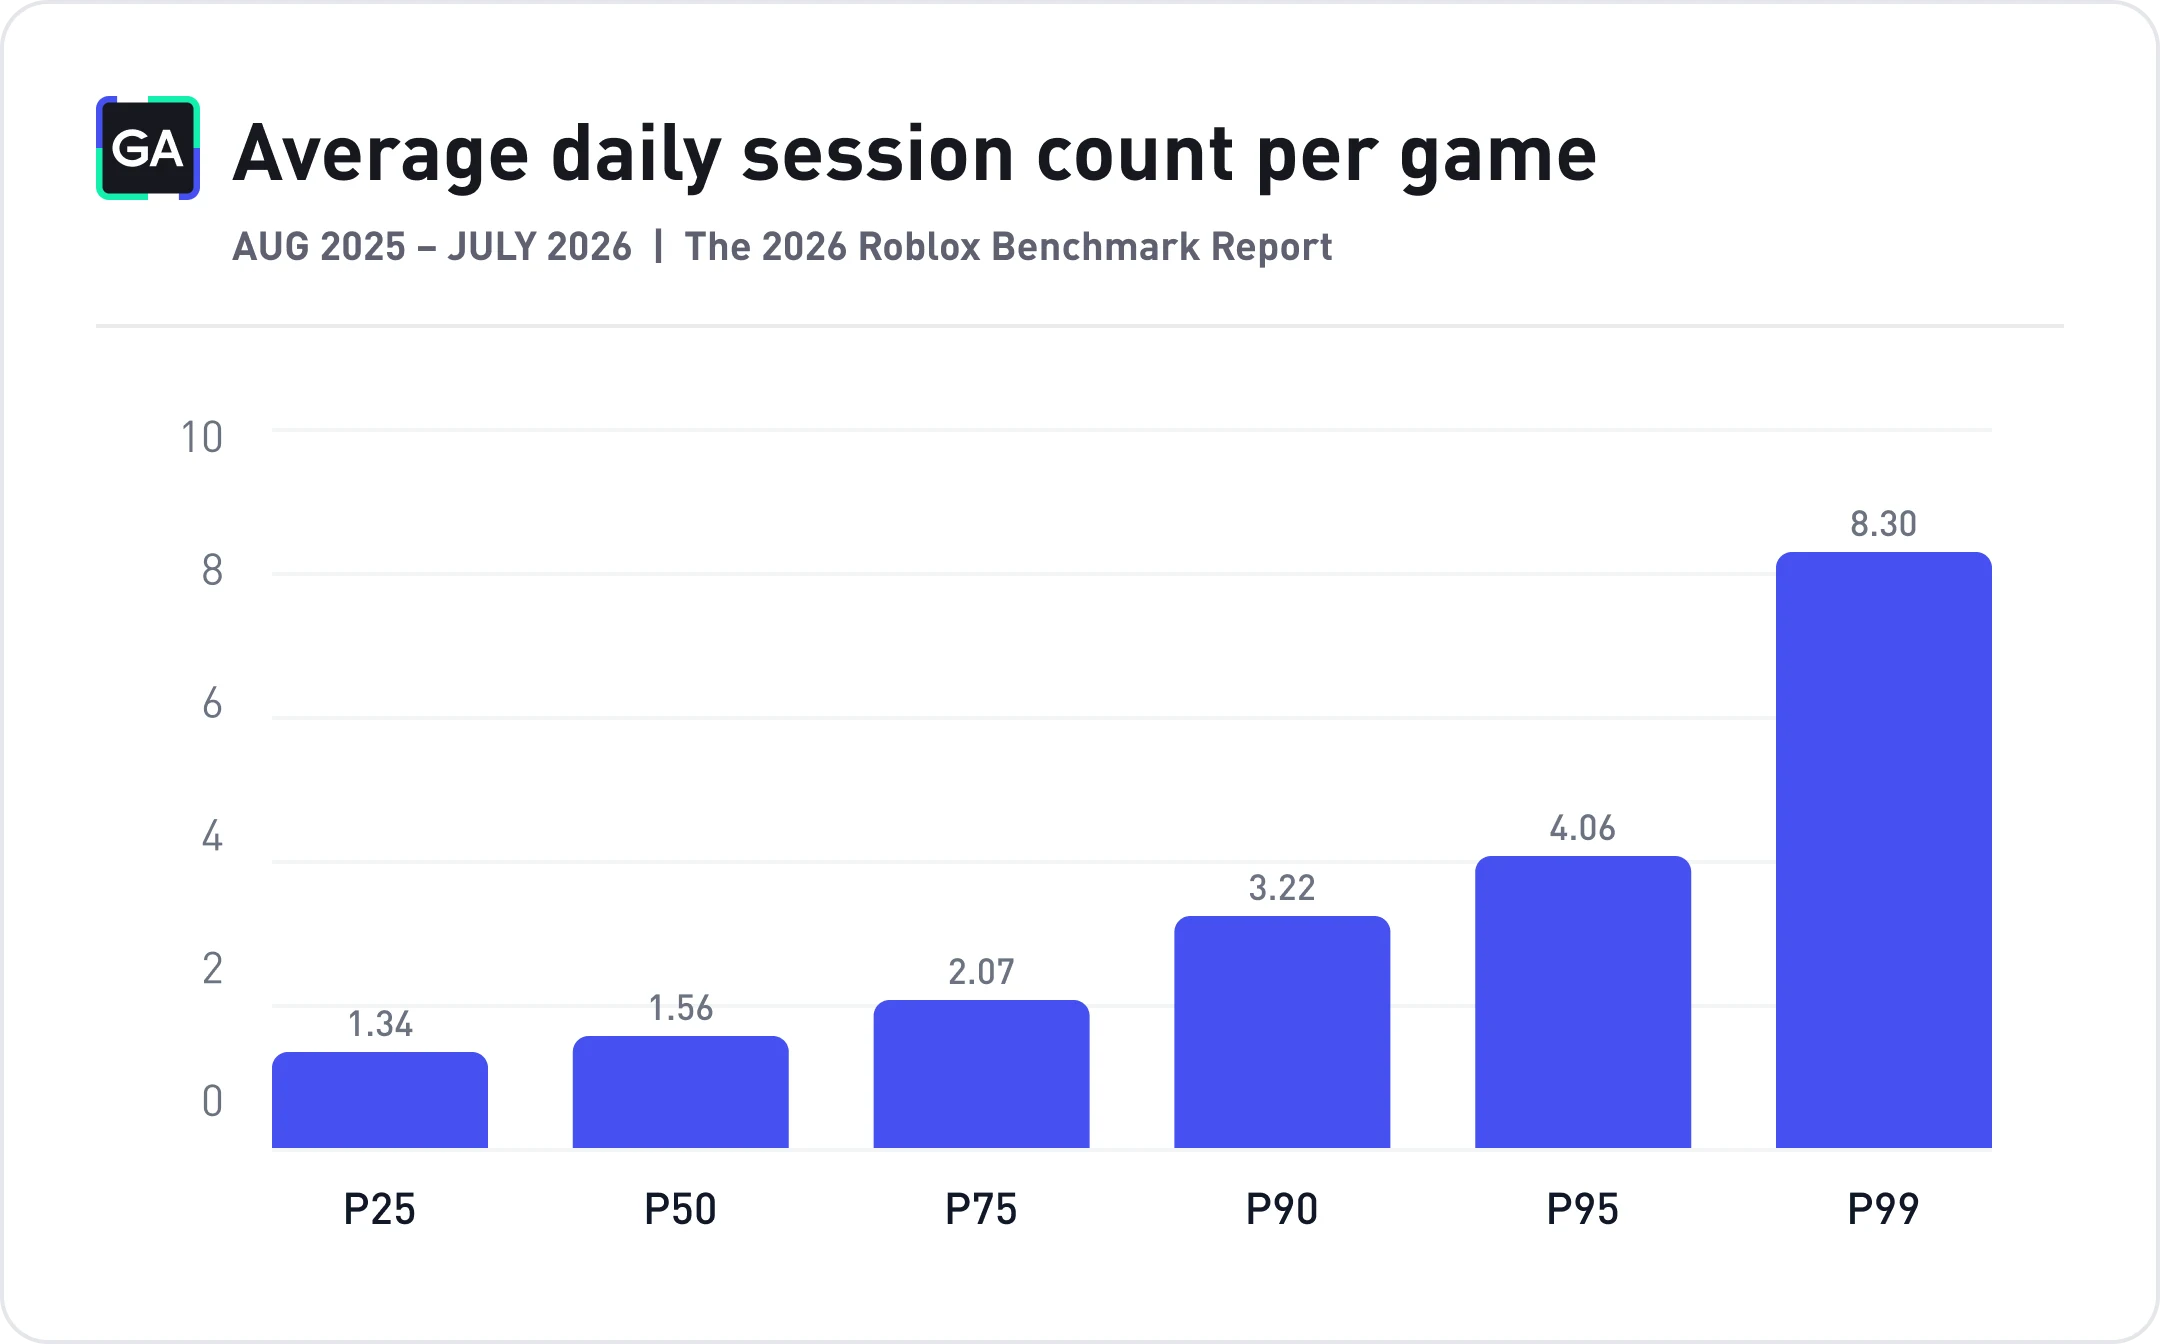
Session count measures how many separate visits a game gets from the same player in a day, distinct from how long each visit lasts. The median game sees 1.56 sessions per player per day, just above a single visit. That climbs to 2.07 at the 75th percentile and 3.22 at the 90th. The 95th percentile reaches 4.06 sessions, and the top 1% of games hit 8.30.
Unlike session length, where the shift to large established titles compressed the distribution, session count moved up more modestly across the board. The top of the distribution still climbs gradually rather than pulling sharply away. Even the 99th percentile, at 8.30, sits within reach of a well-designed return loop rather than in a different category entirely.
Average retention per game
Retention on Roblox behaves differently than on almost any other platform, and the numbers below should be read with that in mind before anything else. At the median, even among large, established titles, only 10.3% of players return the day after their first session, 1.6% are still around a week later, and by day 30 that's down to 0.5%. This isn't a sign of broken games. It's what retention looks like on a platform where the typical player is choosing between millions of free, one-click experiences rather than committing to something they installed.
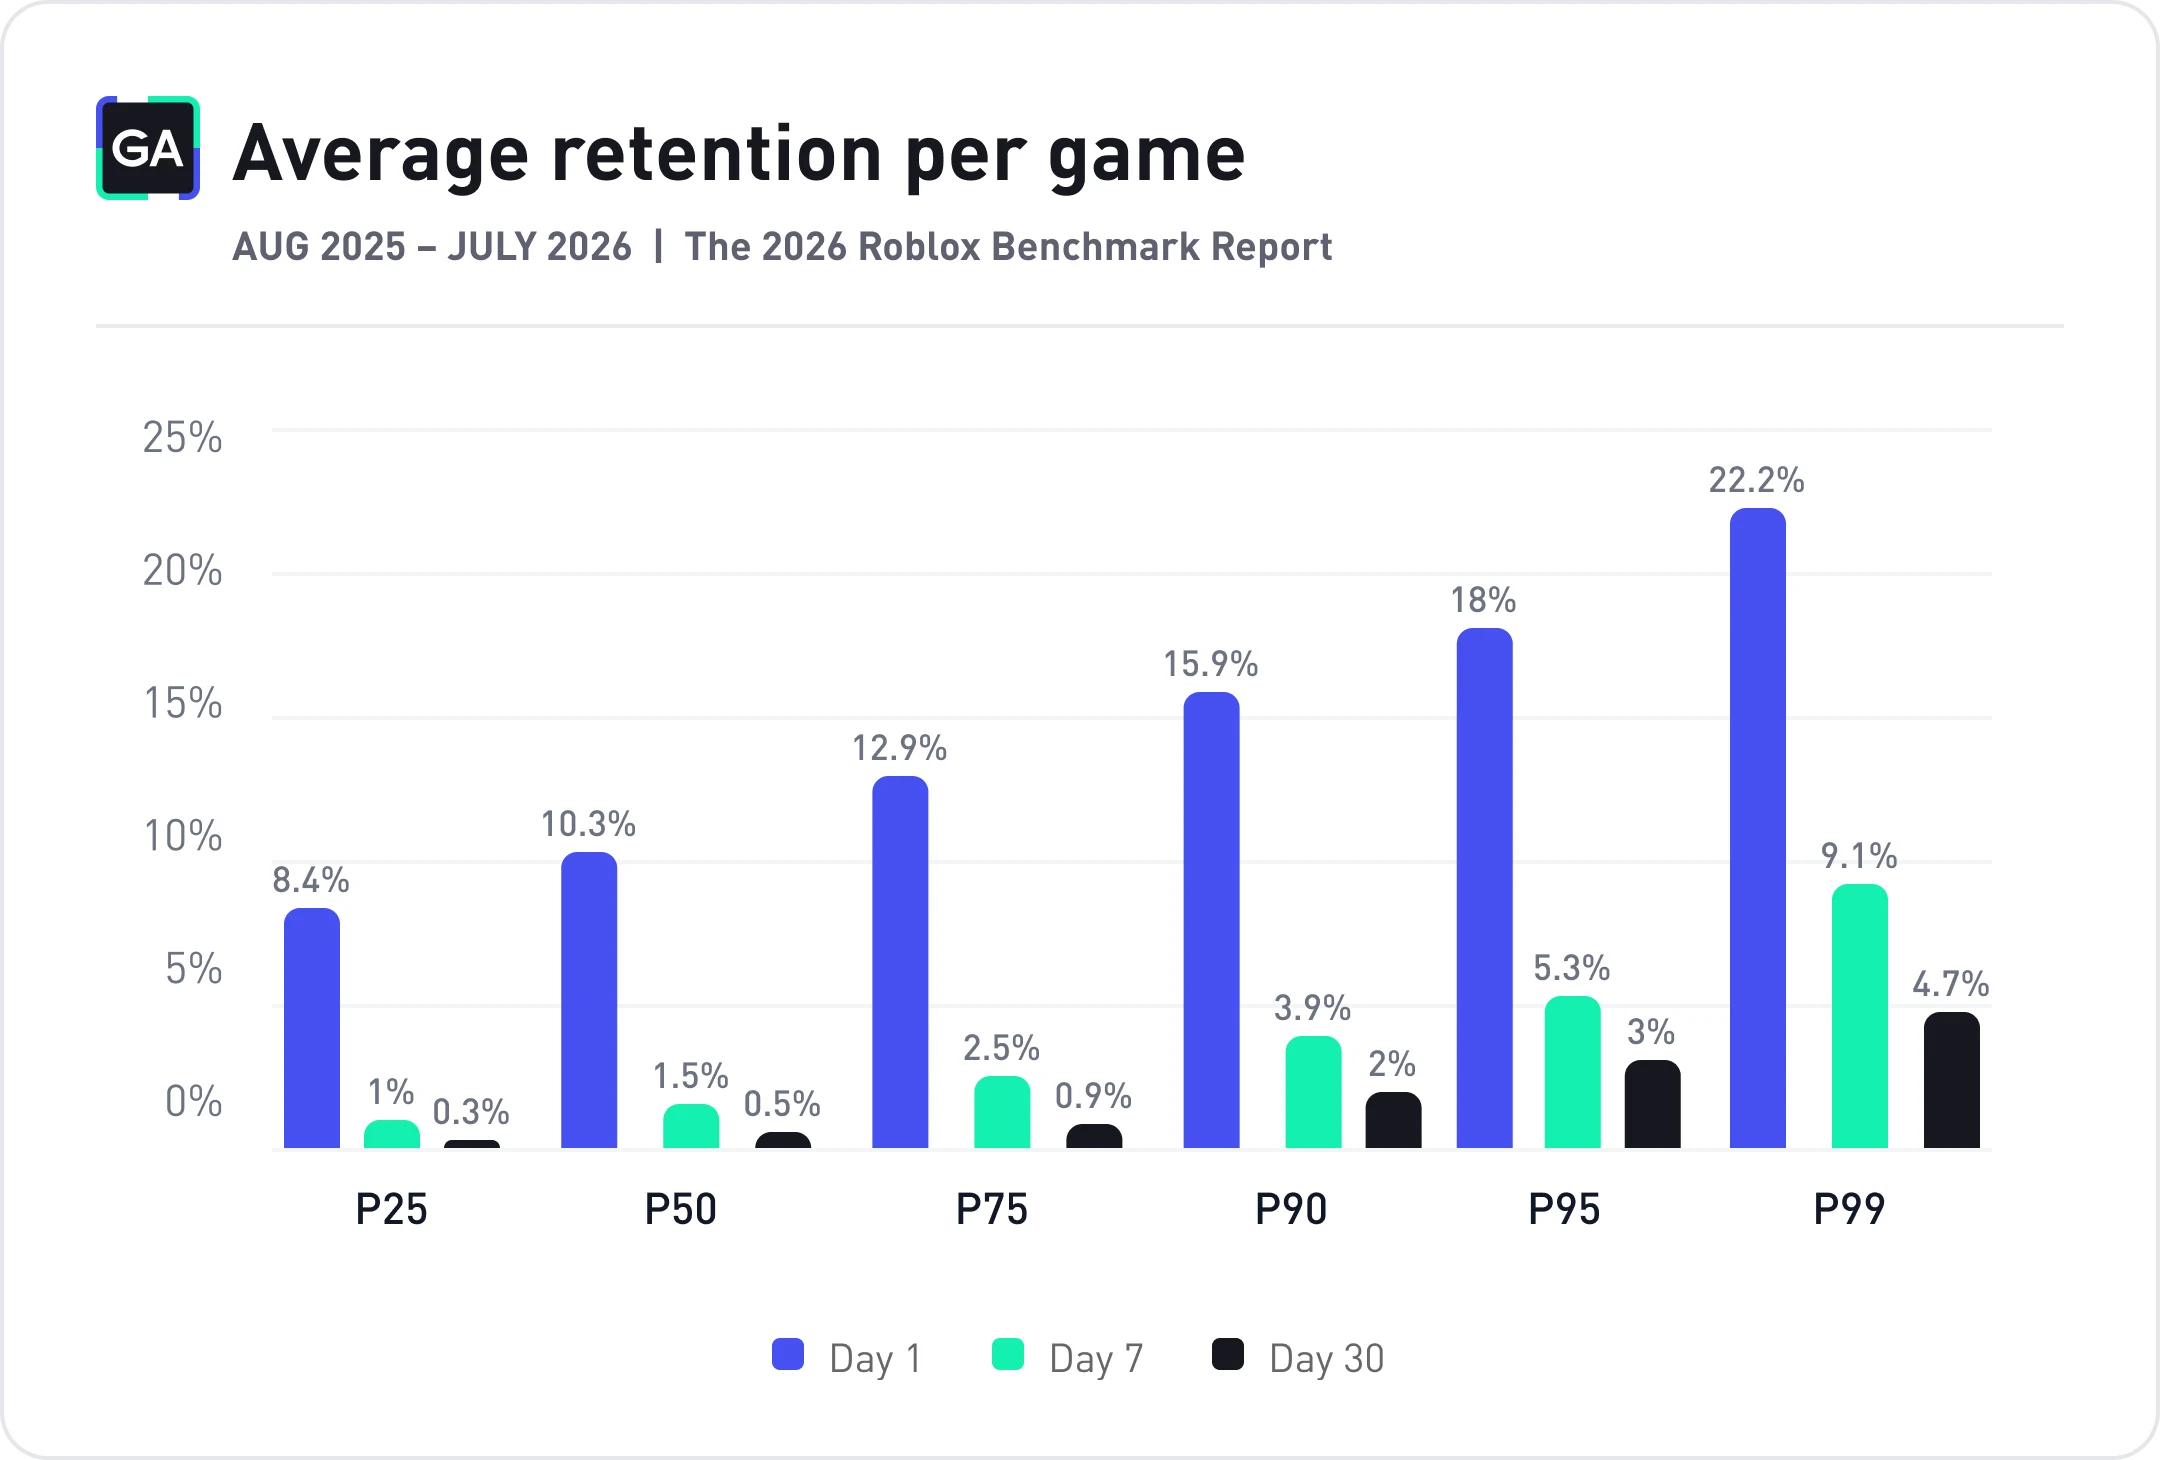
Note on calculation: Some circulated charts put "good" D1 retention at 20%, "excellent" at 40%, but those figures typically come from small samples of already-promoted games, not a broad cross-section. Even our data, drawn from large 1M+ MAU titles, sits well below those numbers at the median. If your retention matches or beats what's shown here, you're likely closer to healthy game.
It starts with FTUE and understanding the fantasy. You can teach a player every mechanic and still forget to sell the fantasy while you do it, which is what tanks D1. The D1/D7/D30 split is really just where we focus design effort at each stage. It all compounds and overlaps, but D1 is FTUE, D7 is progression, and D30 is social. The tell for whether the fantasy stuck with the players is in the post FTUE drop-off. If it didn't land, you get quick drop-off and no return. If it did, you get quick drop-off but high return, or best case, small drop-off and high return.


Average revenue per paying user per game
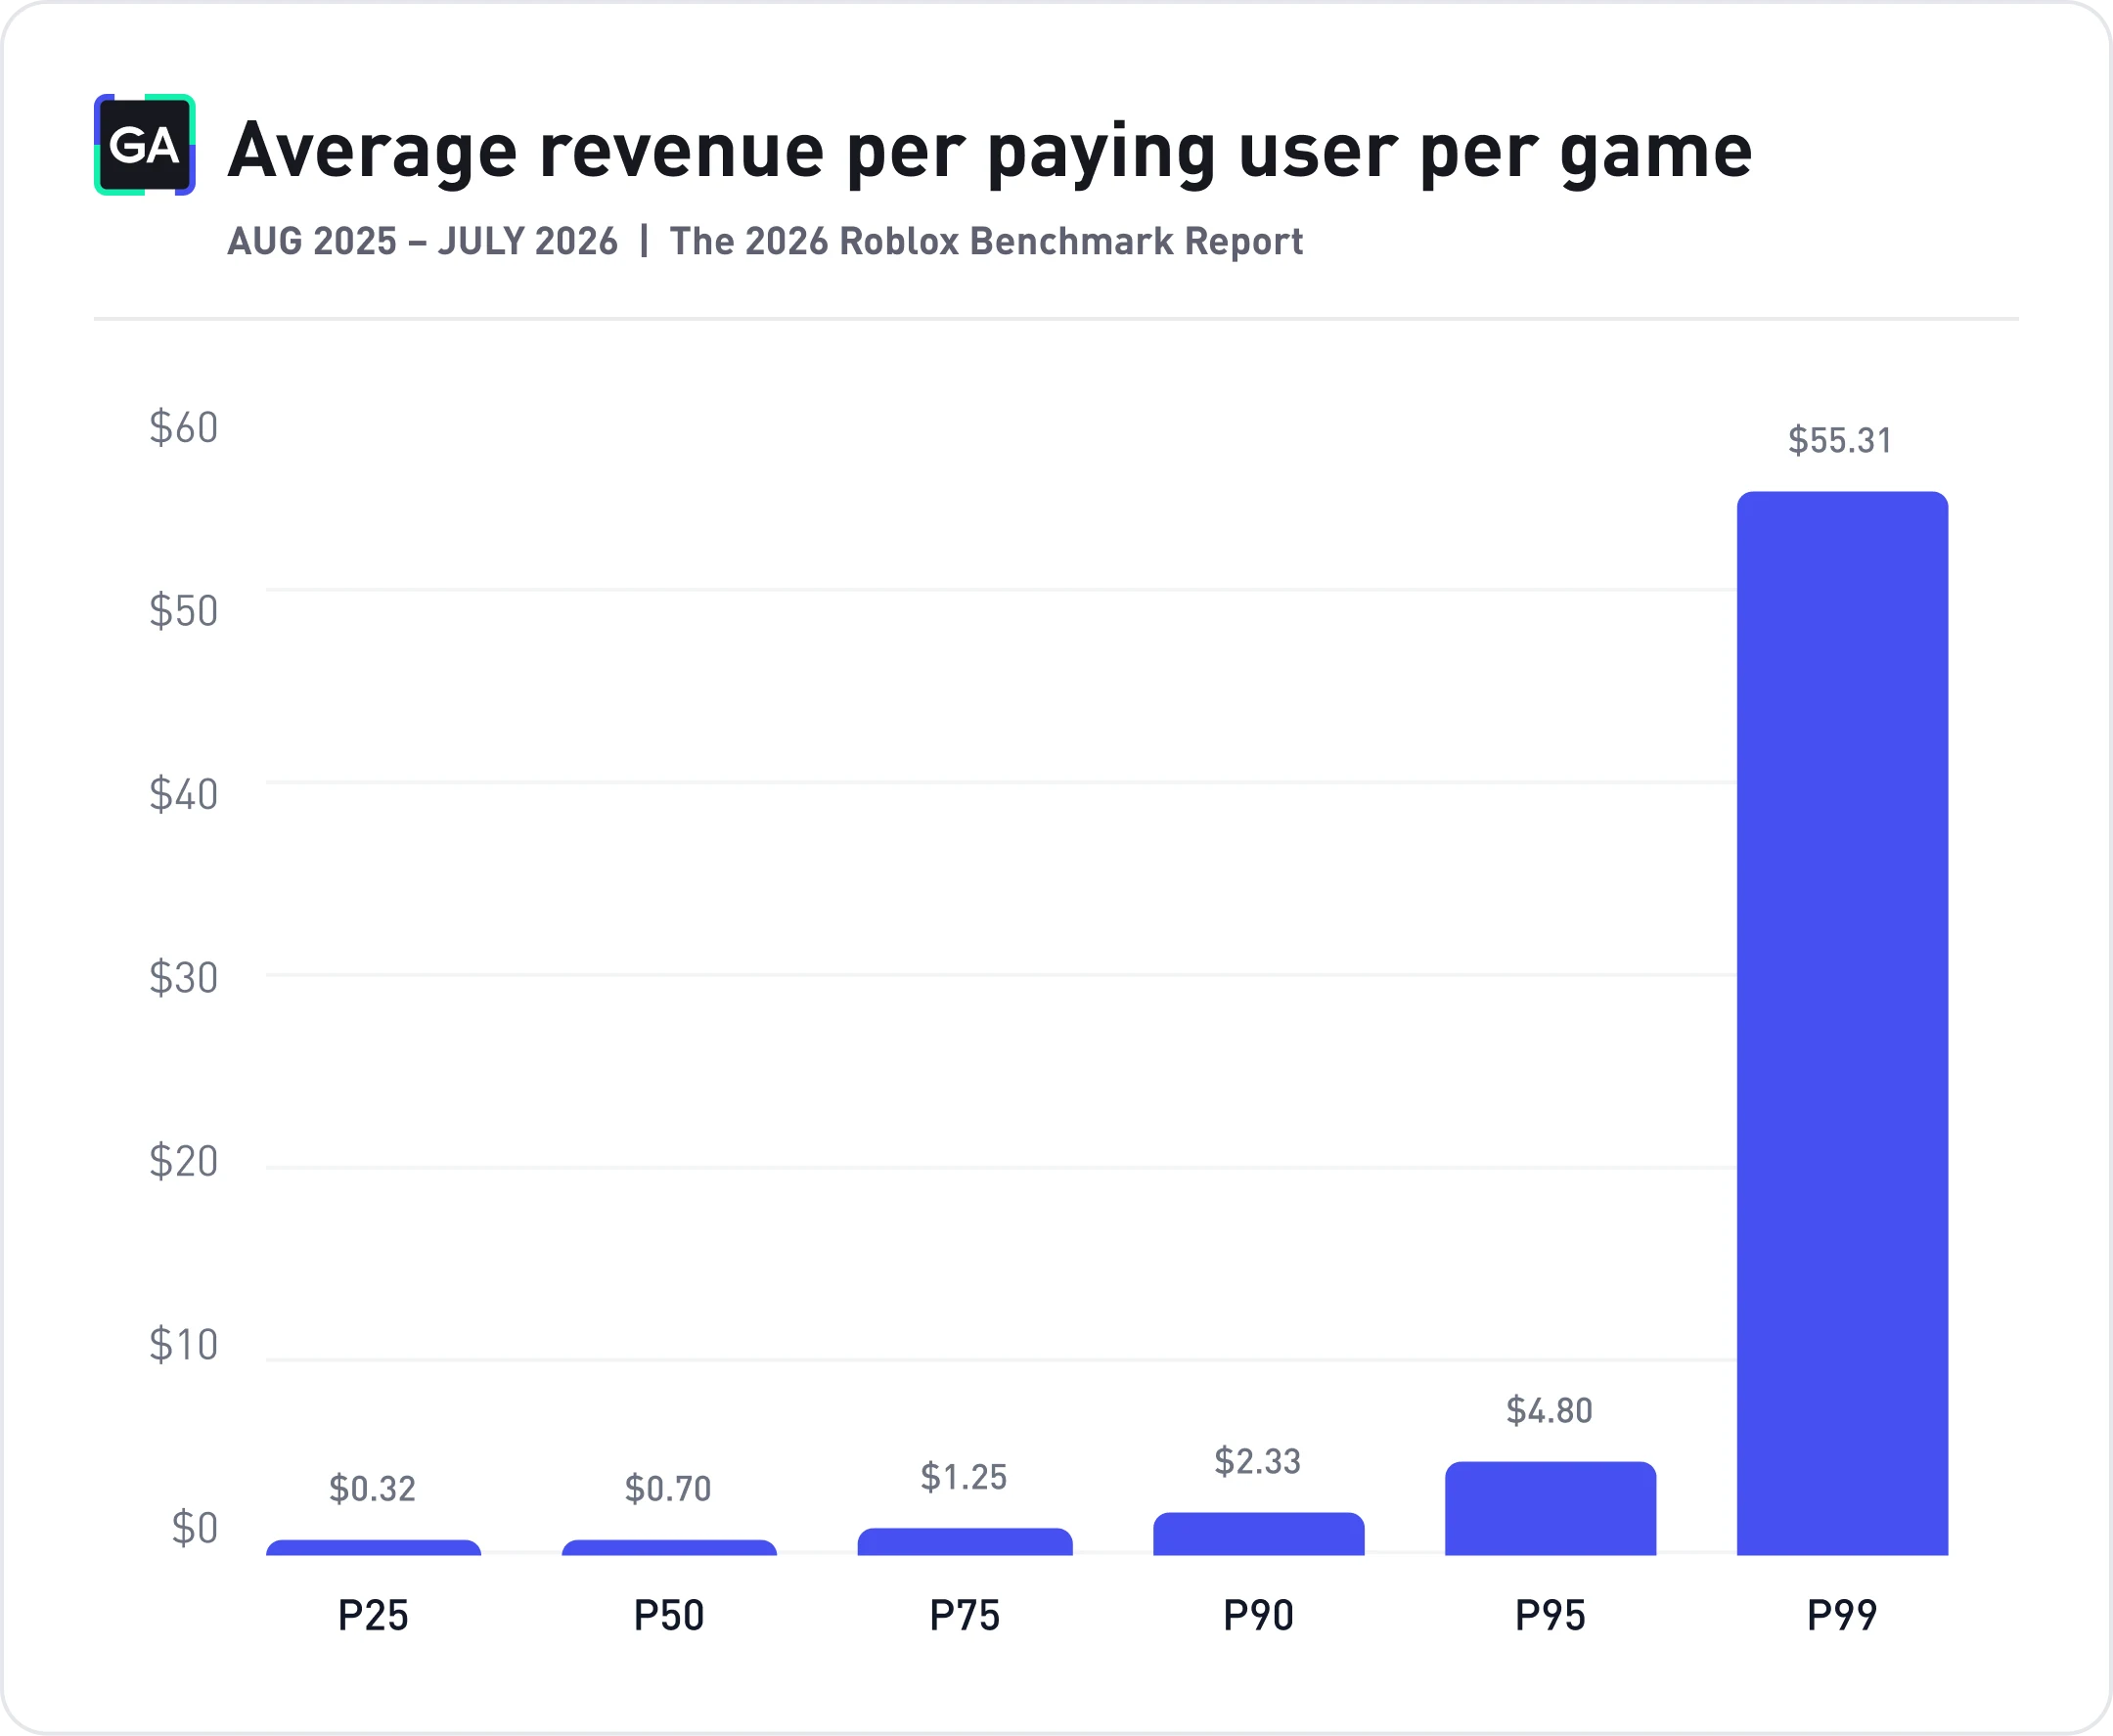
This metric ranks games by their average revenue per paying user, not players by how much they spend. The median game, the one sitting exactly in the middle of the distribution, sees its paying players spend $0.70 on average. Move up to the 75th percentile and that figure is $1.25; the game at the 90th percentile averages $2.33 per payer, and at the 95th percentile, $4.80.
Conclusion
The clearest pattern in this report shows up in almost every section: attention and spend on Roblox are finite, and they are not distributed evenly. A small number of players account for a disproportionate share of activity and revenue, and a small number of games capture far more of both than the typical title does.
Every player brings a limited pool of time and money to the platform as a whole. No single game creates more of either, it can only earn a larger share of what already exists. That's true whether you're looking at a player opening Roblox a handful of times a day across dozens of experiences, or a paying player who has already decided to spend somewhere on the platform and simply hasn't decided where yet. The games that grow are the ones that capture more of an existing budget, not the ones that assume they're the only claim on it.
The same concentration shows up at the game level. Even among the large, established titles in this year's sample, most retain few players past the first week and most payers spend modestly. The games sitting at the top of these distributions aren't incrementally better, they're operating at a different scale entirely, and Roblox's own August 2026 discovery guidance suggests that gap may widen further: games strong in both retention and monetization are now positioned for broader reach than games strong in only one.
None of this means smaller or newer games can't compete. It means the fastest path there is rarely maximizing a single number in isolation, a longer session, a higher spend, a better D1 rate, but building the kind of game a player chooses to spend their limited time and money on, again and again, instead of the dozens of other options a click away.
GameAnalytics for Roblox creators
Everything in this report points to the same challenge: on a platform this large, capturing a bigger share of a player's limited time and money takes more than intuition. GameAnalytics' official Roblox SDK gives you the visibility to act on it by automatically tracking player behavior, session performance, and revenue, with tools to segment players, test changes live, and export data into your own stack when you need to go deeper.